Evidence in favour vs evidence against

:bump:

Maybe people are too exhausted from the last thread to even try to start a flame war on this thread. I wonder if this thread would do better in the Science forum, where you have fewer readers, but you will get more serious discussion.

My bias concern is "when is there evidence that it's worth doing something". Cooler years took off pressure to act quickly, but it never removed the idea that we'd eventually need to act. It merely shifted the timelines.

If I understand correctly, you are concerned that the concentration of Carbon Dioxide in the atmosphere has increased from 0.0275% to 0.04% over the past one hundred years or so. (Whether the legal limit should be 0.05% or 0.08% is another subject.) You are also concerned that the average global temperature has increased over the same period. The issue, of course, is unintended consequences.

Your general tone gives me the impression that you also believe in a long-term, sustainable solution where everybody is a winner. You do not believe going back to the stone age and cutting the world human population to 7 million is an option. You are looking for a solution that says, "This way is just better." I think we were agreed some time ago that electricity is a better way to move vehicles, and solar is the best source of power, eventually, once we solve the logistical issues.

I guess part of the problem is that there's no alternative climate theory proposed. It's not a question of 'will heat be retained in toto?' but 'where will it be retained?'

Earlier, I asked if the power output of the sun is a constant, and I got an answer. It amounts to about 0.1%.

Question: Does this mean solar power is approximately 1366 + 2sin(wt) W/m²?

Well, they're not thermodynamically more dicey. It's not like 'greenhouse gas' or 'forcings' are sketchy concepts.

They are not. If you draw a box around the Earth, the energy going in has to be equal to the energy going out at equilibrium. If the current energy budget shows 20 W/m² of Infrared passing through the Earth's atmosphere into space, and if some future shows only 19 W/m², then that 1 W/m² has to be dissipated by the Earth's atmosphere to make up the balance.

What I found is that during the 'hiatus', I was looking for places for the heat to go, whether there was some buffering capacity we'd not considered.

I have not made any attempt to figure out the thermal capacity of the Earth's surface, oceans, and atmosphere, or any kind of time constant for warming and cooling. If the Carbon Dioxide level remained constant, how long would it take for the trend to stabilize. I think it is not that long at all.

At your latitude, you get the most solar power around June 21, and the least solar power on December 21. The warmest and coldest days are not for another month.

If you look at the charts posted here, you do not see a gradual warming trend, where each consecutive year is incrementally warmer than the other. That is what you would see if you are going through the buffering capacity you are talking about.

What you see resembles a stock chart. You have highs and lows - and if you drew it like a stock chart, a stock market technician would say it is a rising trend. You have higher highs and lower lows. Correct?

To get the answer you are looking for, you should examine the Earth's energy budget, and go through the items one by one, and look for what is changing.

The W/m² reaching the Earth's surface has to be dissipated. It gets transferred to the atmosphere or radiated. I called that number 174.

Question: How much does the energy reaching Earth's surface vary from year to year?

If solar power is ±0.1%, then this will directly affect the power reaching Earth's surface. I get a difference of ±0.09°C. That would mean the range of temperatures from high to low would be 0.18K°C.

That is all I can think of for now.
 
Harv - Any number of short term variables can and will cause the average global temperature to be (at least observationally) a stochastic process. The random part is completely irrelevant to any discussion of global warming.
 
Harv - Any number of short term variables can and will cause the average global temperature to be (at least observationally) a stochastic process. The random part is completely irrelevant to any discussion of global warming.

Where is the randomness coming from?

The Earth is a very massive object and it stores heat energy. If it is receiving more energy than it is radiating, then the average temperature will increase. If it is radiating more energy than it is receiving, then the average temperature will decrease. The converse is true. If the Earth's average temperature is increasing, then it is receiving more energy than it is radiating. It is straight-up physics.

I will try to number my points.

1. I was suggesting that over the 11-year sunspot cycle, the energy coming from the Sun will vary very slightly. This will directly change the number of W/m² received by the Earth to be dissipated. The SWAG number I proposed was ±0.9°C.

2. Over the course of a single year, the Earth goes through a cycle of Winter in the Northern Hemisphere, and Winter in the Southern Hemisphere. The amount of snow and ice cover will vary from year to year, depending on weather patterns. I assume we are agreed that weather patterns are random. If the Earth reflects more energy over the course of a year, then this will have a cooling effect.

I would also suggest that the Earth reflects a slightly different amount of energy in Northern Hemisphere Winter than it does in Southern Hemisphere Winter. So there will be a pattern in the energy the Earth receives that resembles a heartbeat.

I do not have any data on this. How much does the Solar energy reflected by the Earth's surface vary over the year and from year to year?

3. Cloud patterns will vary - and so will the amount of Solar energy reflected by the Earth's surface.

4. Earth's volcanic activity varies from year to year. This changes how much solar energy is reflected.

5. Some of Earth's energy is generated internally. It does not amount to much, but does it vary from year to year? I also have not seen it any energy budget I have looked up, but every fraction of a W/m² counts. This energy also has to be dissipated.

6. The chart presented by Tokala only gives year to year data. If the Earth's average temperature is responding to a very slight variation of the Sun's radiation over the course of an 11-year cycle, then one data point per year is not very much. How well do you capture a sine wave with 11 points? The data will look random because you are basically capturing this data over random points of a sine wave. Year to year data will certainly not capture what is suggested in 2.

Put in different terms, say you have X in your bank account at the start of the month. Over the course of the month, there have been deposits and withdrawals. At the end of the month, you have Y in your bank account. Obviously, Y is equal to X, plus deposits, less withdrawals.

If the average temperature increased by 0.1°C over the last year, then there was a large increase in the Earth's energy balance. It received more energy from the Sun than it dissipated into space. None of the energy budgets I have looked at show how we got from X to Y.

And just like a budget, when we get these numbers, we can go over them one by one.

7. If the means of measuring the Earth's temperature includes random variation, then, yes, the variation of the measured average temperature will be random.

That is all I can think of at this time. Got any to add to the list?
 
Where is the randomness coming from?

The Earth is a very massive object and it stores heat energy. If it is receiving more energy than it is radiating, then the average temperature will increase. If it is radiating more energy than it is receiving, then the average temperature will decrease. The converse is true. If the Earth's average temperature is increasing, then it is receiving more energy than it is radiating. It is straight-up physics.
I suspect you have somehow incorrect idea about the order of magnitude of the properties of the various heat sinks of earth's climate system.

Your appear to build an argument around the observed surface temperature and energy balance of earth, and kinda tack on "everything else", i.e. oceans, cryosphere, lithosphere.

This won't really work, as the oceans are by far the dominant part of the thermal capacity and inertia of earth' climate system.

I have not made any attempt to figure out the thermal capacity of the Earth's surface, oceans, and atmosphere, or any kind of time constant for warming and cooling. If the Carbon Dioxide level remained constant, how long would it take for the trend to stabilize. I think it is not that long at all.
Turns out it is comparatively easy to get at those time constants, at least for relatively fast climate processes (years to decades):
https://tamino.wordpress.com/2013/02/23/once-is-not-enough/

The best time constants turned out to be 2 years and 26 years. This is in good agreement with the results of GISS climate simulation models, which suggest about a 30-year time scale for the climate system as a whole. The “fast” coefficient was 0.17 deg.C/(W/m^2) and the “slow” coefficient 0.51 deg.C/(W/m^2), indicating overall climate sensitivity of 0.68 deg.C/(W/m^2), which gives a sensitivity to doubling CO2 of just about 2.5 deg.C.

It also shows that present estimates of climate forcing, combined with a sensible physical model, reproduce observed temperature.

But, and that's a big but, this doesn't capture century and longer scale processes, like deep ocean waming and polar ice sheet reactions.

I will try to number my points.

1. I was suggesting that over the 11-year sunspot cycle, the energy coming from the Sun will vary very slightly. This will directly change the number of W/m² received by the Earth to be dissipated. The SWAG number I proposed was ±0.9°C.
It would be ballpark of ±0.1°C if earth' thermal inertia would be dominated by the atmosphere. It is not. The actual value seems to be in the ballpark of ±0.02°C. For solar activity to have a notable affect on the surface temperature, a longer phase of a "quiet" sun would be required (think Maunder Minimum), and even this would reduce temperature at best for 0.3°C, more likely only 0.1°C.
For a detailed discussion, see this paper:
http://www.pik-potsdam.de/~Stefan/Publications/Journals/feulner_rahmstorf_2010.pdf
2. Over the course of a single year, the Earth goes through a cycle of Winter in the Northern Hemisphere, and Winter in the Southern Hemisphere. The amount of snow and ice cover will vary from year to year, depending on weather patterns. I assume we are agreed that weather patterns are random. If the Earth reflects more energy over the course of a year, then this will have a cooling effect.

I would also suggest that the Earth reflects a slightly different amount of energy in Northern Hemisphere Winter than it does in Southern Hemisphere Winter. So there will be a pattern in the energy the Earth receives that resembles a heartbeat.
No problem with that argument.


I do not have any data on this. How much does the Solar energy reflected by the Earth's surface vary over the year and from year to year?

3. Cloud patterns will vary - and so will the amount of Solar energy reflected by the Earth's surface.[/QUOTE]

Good queston, but simply by the fact that the majority of year-to-year temperature differences can be attributed to other factors, it would be again ±0.1°C or less.


4. Earth's volcanic activity varies from year to year. This changes how much solar energy is reflected.
No argument here, see the graphs above, and the paper I linked.

5. Some of Earth's energy is generated internally. It does not amount to much, but does it vary from year to year? I also have not seen it any energy budget I have looked up, but every fraction of a W/m² counts. This energy also has to be dissipated.
And while you are at it, add tidal friction, and heat from thermal power plants and other fossil fuel combustion ;) Never mind albedo change due to human land use, which likely overwhelms all the above.
Spoiler :


And all of those pale against the anthropogenic increase in greenhouse gasses.


6. The chart presented by Tokala only gives year to year data. If the Earth's average temperature is responding to a very slight variation of the Sun's radiation over the course of an 11-year cycle, then one data point per year is not very much. How well do you capture a sine wave with 11 points? The data will look random because you are basically capturing this data over random points of a sine wave. Year to year data will certainly not capture what is suggested in 2.
You can be assured that each data point is based on at least daily measurements.
http://lasp.colorado.edu/home/sorce/data/#avail_data


If the average temperature increased by 0.1°C over the last year, then there was a large increase in the Earth's energy balance. It received more energy from the Sun than it dissipated into space. None of the energy budgets I have looked at show how we got from X to Y.
And just like a budget, when we get these numbers, we can go over them one by one.
And once again, this approach doesn't work if you ignore the oceans.


IPCC AR4 said:
Figure 5.4. Energy content changes in different components of the Earth system for two periods (1961–2003 and 1993–2003). Blue bars are for 1961 to 2003, burgundy bars for 1993 to 2003. The ocean heat content change is from this section and Levitus et al. (2005c); glaciers, ice caps and Greenland and Antarctic Ice Sheets from Chapter 4; continental heat content from Beltrami et al. (2002); atmospheric energy content based on Trenberth et al. (2001); and arctic sea ice release from Hilmer and Lemke (2000).


7. If the means of measuring the Earth's temperature includes random variation, then, yes, the variation of the measured average temperature will be random.
Yes, on the timescale of a few years internal variability drowns out changes in external forcings (unless we have have a pinatubo-scale volcanic eruption). Not sure if "random" is the correct description for this variation.
 
Is this cognitively unfair?

Not necessarily. Doing an experiment often leads to far more confirmation (or disconfirmation) if it turns out one way, versus another. Bayes's Theorem. An event which, on the null hypothesis, is wildly improbable, and which on the hypothesis of interest, has (say) 1/5 chance, will strongly support the hypothesis of interest, if it happens. If it doesn't happen, they hypothesis of interest takes a small hit to its credibility, but only a small one.

Should another record-breaking year sway people's opinion? Should a lack of a record-breaking year sway people's opinion?

Yes, and yes, but not necessarily the same amount. See above.
 
Is that animated gif from a reputable, peer-reviewed source?

It's based on http://iopscience.iop.org/1748-9326/6/4/044022/fulltext/

using a 12 month running avarage rather than a single data point for each year. AFAIK the data, but not that specific visualization was provided by Grant Foster (one co-author):
http://www.skepticalscience.com/foster-and-rahmstorf-measure-global-warming-signal.html

Some comments from Foster himself:

https://tamino.wordpress.com/2011/12/06/the-real-global-warming-signal/

and if you feel inclined to check it up, data and R-code are available:

https://tamino.wordpress.com/2011/12/15/data-and-code-for-foster-rahmstorf-2011/
 
Not necessarily. Doing an experiment often leads to far more confirmation (or disconfirmation) if it turns out one way, versus another. Bayes's Theorem. An event which, on the null hypothesis, is wildly improbable, and which on the hypothesis of interest, has (say) 1/5 chance, will strongly support the hypothesis of interest, if it happens. If it doesn't happen, they hypothesis of interest takes a small hit to its credibility, but only a small one.

I'd think the keyword here is "record". What you say is of course true, but it's equally true for very warm year, it doesn't have to be the warmest measured. The fact that the year is the warmest this far doesn't give any more credibility to the alternative hypotheses.

To illustrate it with an example, suppose that the null hypothesis is that the average temperature of the year has mean 0 C with sd 5 C and you measure 10 C average. Under the null hypothesis the probability of at least so warm year is about 2 %. Now, suppose that you measure 10 C average and that is the the highest measured temperature this far. The latter fact doesn't change the probability of it being a fluke in any way,

The biggest problem with the record measurements is that you're bound to have them anyway. Even if the climate didn't change at all, there has to be one year that is record warm. In addition, if we think the law of large numbers, the record is bound to be broken some day too, whether the climate changes or not.

A propos, one climate change bias I love is how the sceptics always on a cold day complain "What climate change? It's freezing out here!". Never hear them saying the opposite on a warm day.
 
Here is what i was looking for:


http://en.wikipedia.org/wiki/Earth'...ystem-satellite-infrared-radiation-fluxes.jpg
I am curious what this looked like in pre-industrial times.

I suspect you have somehow incorrect idea about the order of magnitude of the properties of the various heat sinks of earth's climate system.

I actually have not given much thought of the time constants involved and was considering the Earth's surface in general, not distinguishing between land and sea. But yes, ocean temperatures are more stable than land temperatures, as can be seen by the huge seasonal temperature changes in inland areas as opposed to coastal areas.

If we are introducing a sinusoidal signal, then we have to consider the time constants. I was assuming the time constant of the atmosphere was small compared to the 11-year solar cycle.

Your appear to build an argument around the observed surface temperature and energy balance of earth, and kinda tack on "everything else", i.e. oceans, cryosphere, lithosphere.

The argument I was trying to build is a small change in temperature represents a large change in energy. Large changes in energy do not happen at random.

This won't really work, as the oceans are by far the dominant part of the thermal capacity and inertia of earth' climate system.

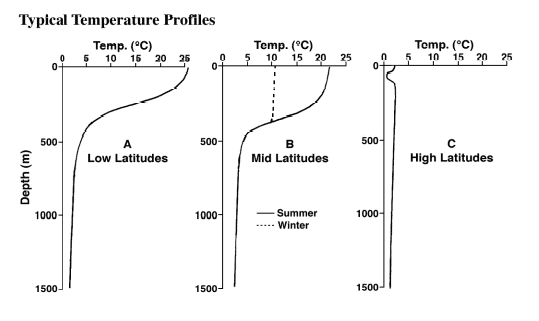
I have only just started to consider this. As well as I understand land, you do not have to dig very far before you are at the geo-thermal gradient. Does it work the same way for oceans - only the first 500 meters or so absorbs heat?
 
The problem is that we should be warmer according to the models, but we aren't.

Models predicted an ENSO event this year due to observable ocean heat content anomalies, however, those heat anomalies dissipated before reaching the ocean surface, which while unusual, is not impossible. So, "the models" were not wrong; they were fed with information that, in aggregate, would lead to the most likely result (i.e., a moderate ENSO event).


In fact this record year is only slightly higher than the previous record, which is well within the margin of error. As you can the amount of the increase is about half the error uncertainty of the dataset.

You're comparing a strong ENSO year with a marginalone. ENSO years typically result in elevated global temperatures, and if you looked at a graph of annual temperatures, you'd see that 1998 was quite warm relative to years just before and after, but the upward trend since then has continued (although more slowly as heat gets sequestered in the ocean), making it easier and easier for annual global temperatures to exceed the 1998 record.
 
That's kinda the way I'm worried it will play out, a step-wise ratcheting. Each 'lull' will then cause us to say "this time it's different"
 
I am curious what this looked like in pre-industrial times.
Pretty much the same. Remove a W/m² or two from the "total outgoing infrared radiation" part


If we are introducing a sinusoidal signal, then we have to consider the time constants. I was assuming the time constant of the atmosphere was small compared to the 11-year solar cycle.
- Your "signal" is very weak compared to the "noise" in the system
- It is not nearly sinusoidal, but of varying period and amplitude, with lots of noise on top of it
- the system has a huge inertia (through coupling with the oceans, cryosphere, etc.)
- the system is not in equilibrium (anthropogenic greenhouse forcing)

In short, you need sophisticated statistical analysis to detect any influence of the solar activity cycle on the global mean surface temperature at all.
Compared to the steady temperature increase of about 0.15-0.20°C per decade, a slight wobble with an amplitude of about 0.05°C (yearly data) to 0.1°C (monthly data), which cancels out in the longer run, is fairly irrelevant.

The argument I was trying to build is a small change in temperature represents a large change in energy. Large changes in energy do not happen at random.
According to the current state of science, ENSO (the single biggest influence on global surface temperature fluctuations) is not a predictable process, so yes, large changes of energy do happen "randomly".
Of course the total heat content of the climate system is not changing randomly, but rather the distribution of said heat content.
More heat than usual buried in the oceans --> colder surface temperatures
Less heat than usual buried in the oceans --> warmer surface temperatures
For example the "Super El-Nino" of 1997/98 visualized:


From http://www.goes-r.gov/users/comet/tropical/textbook_2nd_edition/navmenu.php_tab_5_page_2.1.3.htm

I have only just started to consider this. As well as I understand land, you do not have to dig very far before you are at the geo-thermal gradient. Does it work the same way for oceans - only the first 500 meters or so absorbs heat?
Yes and No.
Yes as only the first hundred meter or so absorbs almost all solar energy that enters the ocean.
No in that heat transfer doesn't work primary through static conduction like on land, but through movement and mixing of of water, driven by winds, tides and the thermohaline circulation.
Example of ocean temperature profiles:


Note that the temperature drops right to the bottom, unlike temperature profiles on land.
 
^^Then if you count the energy stored in the entire ocean, instead of the first 700 meters, you should see a steady increase reflecting the vast majority (about 90%) of the 0.6 W/m² NASA says we have been running as a surplus over the past ten years.

Since you have been providing so many charts, you probably have another chart showing the energy stored in the entire system.
 
Since you have been providing so many charts, you probably have another chart showing the energy stored in the entire system.


And here is a recent review paper straight from the horse's mouth (Dr. Trenberth, probably the foremost specialist in regard of global energy balance):
http://journals.ametsoc.org/doi/full/10.1175/JCLI-D-13-00294.1

You really should take the time to look up a bit of literature for yourself, if you are indeed interested in this topic.
 
The problem is so many things are getting hyped up. take the two cyclones that hit Australia over the past few days. This is what we were told about TC Marcia. http://www.news.com.au/technology/environment/cyclone-marcia-floods-rain-as-clean-up-operation-begins/story-e6frflp0-1227233269868
The cyclone was at category 5 when it grazed Yeppoon battering the coastal town with 285km/h winds. It was downgraded to category 3 when it hit Rockhampton in the afternoon.
But this is what the data said about Marcia. http://www.gdacs.org/Cyclones/report.aspx?eventid=1000145&episodeid=6&eventtype=TC
2/19/2015 6:00:00 PM Category 3 204 km/h (127 mph) km/h ( mph) 87000 people 150.5, -21.7

It never got to category 5 status and yet somehow it is being recorded that it did. About TC Lam this was said in the above article.
In the Northern Territory, Cyclone Lam made landfall as a category 4 system and has now been downgraded to a tropical low.
But this is what the data said. http://www.gdacs.org/Cyclones/report.aspx?eventid=1000144&episodeid=7&eventtype=TC
2/19/2015 6:00:00 AM Category 1 148 km/h (92 mph) km/h ( mph) 1100 people 135.7, -11.7

These storms were hyped up so badly because one uncomfortable fact about this season is that it is the 3rd quietest start to the season since records started. The hype is out of control.
 
We have the same issue with hype over here. Some recent seasons have had 15-20 TC's, but when we get an ENSO event, the news goes nuts over Cat 2s lol

Unfortunately, the sensationalism that the media is drawn to makes credible science look dubious :/
 
Is that animated gif from a reputable, peer-reviewed source?

I wouldn't trust it when it has been shown to only confirm things and not ask the tough questions.
http://joannenova.com.au/2012/06/300000-dollars-and-three-years-to-produce-a-paper-that-lasted-three-weeks-gergis/

Here are some article about the "research". http://www.theguardian.com/science/2012/may/17/australasia-hottest-60-years-study
The last 60 years have been the hottest in Australasia for a millennium and cannot be explained by natural causes, according to a new report by scientists that supports the case for a reduction in manmade carbon emissions.

In the first major study of its kind in the region, scientists at the University of Melbourne used natural data from 27 climate indicators, including tree rings, corals and ice cores to map temperature trends over the past 1,000 years.
If you click on the "new report", which is linkable in the original article, you find the paper has been withdrawn. The only reason for that was the work of bloggers who noticed scientific flaws in the work. That is where the real hard work is done, not by sympathetic scientists who only confirm their bias and nt question it.
The study, published in the Journal of Climate, will be part of Australia's contribution to the fifth Intergovernmetal Panel on Climate Change report, due in 2014.
Well obviously that didn't happen since it got withdrawn. whoops. But the problem is this. The Bureau of Meteorology doesn't accept data from old Stevenson screen, which was standardised well before the cut off date they arbitrarily use of 1910, yet somehow they provide climate data all the way to 1850, without used the old data. Perhaps because there were terrible heatwaves in the later part of the 1800's? http://trove.nla.gov.au/ndp/del/article/44132389?zoomLevel=5 This is from 14 Jan 1896, which show the terrible toll of the heat back then
The Death Roll.

A Melancholy List.

Apoplexy, Thirst, and Sunstroke.

SYDNEY, Tuesday.

William Clark, aged 51, proprietor of the Royal Hotel, Singleton, died yesterday of heat apoplexy.

Arthur Hassett, a director of the White Reef Company, Wyalong, was attending a meeting inside the company's office, when he was stricken.

His condition is critical.

John McCarker, 26, of Jerilderie, seized with heat apoplexy, has expired.

Six infants have died at Goulburn since January 1 through the excessive heat.

A child sent to the mountains to escape the city heat died at the moment that the train arrived.

The coroner at Collarendabri has returned to the town after holding an inquest on the body of a man which was found in the bush at Burren. The verdict was that deceased (whose name is supposed to be George Schweiss) had cut his tbroat, having apparently be- come insane through the heat and want of water.

A little girl has died at Mount Hope as an effect of the heat.

Two more deaths have occurred at Bourke. One, Mrs. Costello, aged eighty, was found dead in her chair. This makes at least a dozen victims in the Bourke district.

There were many casualties in the city.

A man at Surry Hills sustained a sunstroke. He was taken to the hospital, where he recovered.

A young girl walking along a city street suddenly became demented.

Sydney Merewether, aged 63, a miner from New Zealand, was trans- acting some business in the Union Bank, when he was stricken down. He was at once removed to the hos- pital, but expired.

William Foulston, employed at the post-office tunnel works, was taken to the hospital unconscious through the excessive heat, and died.

James Quinn was working at the embankment at Lady Macquarie's Chair, when he was overcome, and very soon died.

Several men were taken to the hospitals and, under proper treatment, recovered.

Duggle McLachlan, a widower with four children, residing at Balmain, was returning to his home from the city, when he was stricken. Before medical help could be obtained he was dead.

A man, his wife, and their child went out in a boat at Balmain, hoping to escape some of the heat. They were caught in the buster and the boat was capsized. The child was drowned.

http://trove.nla.gov.au/ndp/del/article/44159099?zoomLevel=5
Thunderstorms and High Temperatures.

Alarming Sickness in Many Towns.

SYDNEY, Thursday.

Most depressing reports come from the country districts.

A Cudal correspondent reports that thunderstorms travel over that district daily. A little rain falls, but the weather continues hot and sultry.

A cyclone has passed over Greta. Several buildings were demolished, trees were uprooted, and then rain fell in torrents, descending like at the bursting of a waterspout. Serious damage has been done to the crops in that district.

Yesterday at Albury the shade record was 104.

The condition of Brewarrina is hardly better than that of Bourke. Yesterday's record was 117. On Wednesday night many of the residents walked the streets for hours, the thermometer at midnight registered 109, and the minimum reading was 103. Sickness is alarmingly prevalent.

Bingara was yesterday visited by a terrific thunderstorm. Typhoid is prevalent in this district.

Burraga yesterday registered 100; Cobar, 119, with two deaths registered. Goulburn, 104, with five deaths ; Graf- ton, 100 ; Gundagai, 108 ; Harden, 103; Moree, 109; Tamworth, 101. Wagga, 110; West Wyalong, 114; Young, 108.

The bit in bold it just terrible, a minimum over 39C, just think of that for one second. Considering that BoM ignore good data we really can't trust them when they make proclamations about records when they are using incomplete data and they by not using that data they are not giving accurate information about the past.
 
I :love: the hypocritical media. This i one headline a few months ago. Deeper Ties to Corporate Cash for Doubtful Climate Researcher
Over 1.2 million. Yet here is a recent headline about a recent headline. E.P.A. Carbon Emissions Plan Could Save Thousands of Lives, Study Finds
Of course what is failed to be mentions is the over 45 million in EPA grants to confirm what the EPA wants.
http://junkscience.com/2015/05/05/media-beats-up-willie-soon-but-turns-a-blind-eye-to-epa-funded-researchers-shilling-for-epas-biggest-rule/
Of course they don' have any conflicting financial problems. We are told this is "independent" research. Climate research is basically a big joke.
 
Top Bottom