PieceOfMind's Advanced Combat Odds

What, no histogram?! :mischief:

lol you can joke about it but I did originally have the pie-in-the-sky idea of doing just that... :lol:

This is a histogram (I drew in paint) of expected hitpoints normalized against unit surviving.:D
 

Attachments

  • zzexample3_renormalized.JPG
    zzexample3_renormalized.JPG
    100.7 KB · Views: 381
You can embed images into the text using HTML-ish tags, but I don't think that it would reload the image after you changed it. It would be interesting to test, though. You'd have to write it to disk, however, but since this is for hover text it wouldn't matter if it took a quarter second or less.

Since it's discrete, you could always try ASCII art. :lol:

Code:
++-------- 0HP
+++------- 25HP
+++------- 50HP
+--------- 75HP
+--------- 100HP

Oh hey! You could create little square graphic building blocks for creating a histogram very easily. Just pick a block size that gives you enough resolution and then lay them out on an N x M grid.

I was just showing above the percent chance of ending the battle with the HP on the right. This is what you were showing before, right? That continuous graph looks neat, but is it representative of what you'd actually show, given that each hit delivers a discreet damage?

Perhaps you chose a continuous graph because it was easier to draw both attacker and defender lines on the same graph? Now that I look again, it's possible that your graph isn't continuous--you just drew lines connecting the dots and it looks that way because it is small.

If you used 2% per block for 50 blocks per line, each block could be 2x20 pixels for a 100 pixel long line. That should leave enough room for the HP value at the end. You'd only need 3 blocks: green, red, and blank. That would allow you to recreate the above graph.

Hmm, pretty doable. :)
 
In that little graph, you'll see green and red lines that are brighter - they are the actual possible HP amounts. I merely connected the peaks to make it easier to glance at.

Your idea about making an ASCII histogram got me thinking... You'd need a different font though right? - a constant width one or whatever you call them.

I could make it like this...

Code:
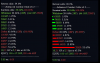
[COLOR="seagreen"]Victory[/COLOR] 75.11% ([COLOR="seagreen"]3XP[/COLOR]) ([COLOR="seagreen"]53.0HP[/COLOR])
[COLOR="seagreen"]Retreat[/COLOR] 7.47% ([COLOR="SeaGreen"]1XP[/COLOR]) ([COLOR="SeaGreen"]15HP[/COLOR], [COLOR="red"]36.8HP[/COLOR])
[COLOR="SeaGreen"]Withdraw[/COLOR] 0.00%
[COLOR="seagreen"]--+[/COLOR]       [COLOR="SeaGreen"] 100HP[/COLOR]: 5.31%
[COLOR="seagreen"]------+[/COLOR]   [COLOR="SeaGreen"] 83HP[/COLOR]: 11.80%
[COLOR="seagreen"]--------+[/COLOR] [COLOR="SeaGreen"] 66HP[/COLOR]: 15.71%
[COLOR="seagreen"]--------+[/COLOR] [COLOR="SeaGreen"] 49HP[/COLOR]: 16.28%
[COLOR="seagreen"]-------+[/COLOR]  [COLOR="SeaGreen"] 32HP[/COLOR]: 14.45%
[COLOR="SeaGreen"]---------+ 15HP[/COLOR]: 19.02%
[COLOR="Red"]Defeat[/COLOR] 17.43% ([COLOR="red"]2XP[/COLOR]) ([COLOR="Red"] 36.8HP[/COLOR])
[COLOR="Red"]+[/COLOR]         [COLOR="Red"] 100HP[/COLOR]: 0.77%
[COLOR="Red"]--+[/COLOR]       [COLOR="Red"] 78HP[/COLOR]: 2.56%
[COLOR="Red"]-----+[/COLOR]    [COLOR="Red"] 56HP[/COLOR]: 4.97%
[COLOR="Red"]-------+[/COLOR]  [COLOR="Red"] 34HP[/COLOR]: 7.37%
[COLOR="Red"]---------+ 12HP[/COLOR]: 9.23%
 
In that little graph, you'll see green and red lines that are brighter - they are the actual possible HP amounts. I merely connected the peaks to make it easier to glance at.

Yes, I realized this is what you probably did, but I didn't explain it very well near the end of my post.

Your idea about making an ASCII histogram got me thinking... You'd need a different font though right? - a constant width one or whatever you call them.

Monospaced. But why not go for the graphic one? It is the same principle, but uses small graphics for each block of the graph. You embed them in the hover text using this text:

<img=Art/ACO/hist_green.dds size=20>​

To cut down on the number of blocks needed for the graph, we could make several versions of each image. Say each block is 20x20 pixels. I'm choosing 20 because that's a decent line height I think that will allow the HP to be tacked onto the end.

So we would need 20 versions of green blocks, with 1, 2, ... 20 pixels of green on the left and blank space on the right. Showing only 2 pixels of height for each, they would look like this:

Code:
#                   |right edge
#                   |

##                  |
##                  |

###                 |
###                 |

####                |
####                |

...

####################|
####################|

To draw a bar out to 53.8%, you'd draw two full (20) blocks, a 14 block, and two blank blocks. Since each block is 20 pixels, that gives you 100 pixels to take the graph up to 100%. The two blank blocks at the end are in case there is another graph line that goes past 60%. This gives the graph a consistent size.

This is exactly as you and I drew the ASCII-based graphs, and it will be only marginally more work, but it will be a real image. I'll see if it works as I'm hoping.
 
The blocks will sit flush together horizontally, but my first test put a 3 pixel space between the lines vertically. These are 20 pixel high blocks. The first line has three blocks: 20, 20, 8. The second has two: 20, 8.


Note that I didn't create a blank block yet, so the two HP values don't line up yet. They will in the final result, though.

We could shrink them vertically and end up with a true histogram (separate bars instead of a contiguous block), a horizontal bar graph. For what you want, I think that works, right?
 
Obviously the height of each bar is not really important. Only for aesthetic reasons would you want to tweak it to a height that looks nice.

It looks pretty neat already.

The thing I'm wondering though is whether it would be better to align the HP values or to stick them on the end of each bar like you're suggesting (I think?). I think I would prefer your way, but it's just something to consider.

I assume what you're planning to do will look kind of like the right pic here. Note the left pic is what my "everything" version is starting to look like..


My main concern now is how appropriate the ordinary scale will be. There are often large chunks of probability on the lowest HP value leading to fairly big spikes like this.
 

Attachments

  • Civ4ScreenShot0191__.PNG
    Civ4ScreenShot0191__.PNG
    100.4 KB · Views: 464
I just hadn't created the empty block yet, but that actually looks pretty good non-aligned. The only reason to align them would be if the blocks had gridlines on them. Given that they won't be flush vertically, gridlines might not look that good.

Also, with the percentage value listed after the HP, the gridlines are less useful. Maybe plain bars like you have are perfect.

Oh, one caveat. Since the blocks must be square, the HP values won't always be flush with the end of the bar--only the edge of the block. For example, for a probability of 22, we'd have a full 20 block and a 2 block, but the 2 block must still be 20 pixels wide. This means there will be 18 pixels of blank space between the end of the block and the HP value. If the next line down is 39%, the end of that bar will be 1 pixel away from its HP value.

Code:
###########          20HP
#################### 40HP
#########################      60HP

That looks a little goofy. Maybe that's enough reason to align all the HP values? I definitely prefer the HP/% values to the right of the bars.

Edit: Oops, wrong closing tag.
 
This is the current state of the different detail levels. What do you think?


Spoiler :
Low detail:
  • Survival odds
  • Main battle outcome probabilities (Victory, Defeat, Retreat, Withdraw)
  • XP for each battle outcome (beside main battle outcomes)

Medium detail:
  • Survival odds
  • Main battle outcome probabilities (Victory, Defeat, Retreat, Withdraw)
  • XP for each battle outcome (beside main battle outcomes)
  • Expected hitpoints conditioned on battle outcome (beside battle outcomes)
  • Att,Def damage per hit and number of hits and odds of hits and CombatRatio
  • Unconditional Attacker Unharmed Odds
  • Unconditional Defender Unharmed Odds

High Detail:
  • Survival odds
  • Main battle outcome probabilities (Victory, Defeat, Retreat, Withdraw)
  • XP for each battle outcome (beside main battle outcomes)
  • Expected hitpoints conditioned on battle outcome (beside battle outcomes)
  • Att,Def damage per hit and number of hits and odds of hits and CombatRatio
  • Unconditional expected Attacker,Defender HP
  • Probability of every possible Attacker HP outcome
  • Unconditional Attacker Unharmed Odds
  • Unconditional Defender Unharmed Odds

Everything!:
  • Survival odds
  • Main battle outcome probabilities (Victory, Defeat, Retreat, Withdraw)
  • XP for each battle outcome (beside main battle outcomes)
  • Expected hitpoints conditioned on battle outcome (beside battle outcomes)
  • Unconditional expected Attacker,Defender HP
  • Att,Def damage per hit and number of hits and odds of hits and CombatRatio
  • Probability of every possible Attacker HP outcome
  • Probability of every possible Defender HP outcome
  • Unconditional expected Attacker,Defender HP
  • Unrounded XP

EF, I have what may be a simpe solution to that problem...

Simply run the bars the other way...like

Code:
-----+++++ 10
-------+++ 20
-------+++ 30
---------+ 40

That way, each row has to be made up of the same number of blocks I believe.
 

Attachments

  • ACOv3 details.PNG
    ACOv3 details.PNG
    340.1 KB · Views: 456
That's looking great. The Retreat Att E[HP] is shown as an integer (no decimal); is that intentional?

As for the bars. The same can be done (my original vision) using the same number of blocks on each row:

Code:
+++++----- 10
+++------- 20
+++------- 30
+--------- 40

So it's whatever you think looks better. It wouldn't be hard to change later anyway, so we can try either way first.
 
I think it will look better if the numbers can sit right beside the bars, hence the right-aligned version.

By the way, the Retreat HP are indeed meant to be an integer - they are fixed for each battle - if the unit withdraws it has to be at 15HP in this example.
 
Oh? I thought retreat worked like this:

If the attacker takes a hit that would kill it, but it has a withdrawal chance > 0%, and it rolls under that %, then the last hit effectively doesn't count and the unit retreats.
 
I just tested leaving off the "size=20" part of the image, and it works fine. I can thus use non-square images and have the HP values lie flush against the ends of the bars as you mocked up on the right image above.
 
Oh? I thought retreat worked like this:

If the attacker takes a hit that would kill it, but it has a withdrawal chance > 0%, and it rolls under that %, then the last hit effectively doesn't count and the unit retreats.

Yes that is right. Keep in mind the 15HP is guaranteed if the unit withdraws. If he withdraws it has to be 1 hit away from dying. The only way he can be 1 hit away from dying is if the defender got him down to 15HP (this example only). If the attacker withdraws, he trivially has an average of 15HP (taking the average of one value).

Maybe you should take a nap then think about it. :p
 
Heh, I see now. I was forgetting that the other values were E[HP], thus the fractions, while this is calculated exactly for each combat. Yes, definitely nap time. :)

This is what I was thinking (though crude still) for the bars:


Instead of having a grid, put tick marks on the bars. With nicer colors (white for the marks?), it may look okay. Meh, maybe just plain, solid bars. There's a reason I don't do any of the BUG icons! :D

In any case, it works and we can make it look nearly any way you want.
 
FWIW, I prefer the medium detail level. I think very few will want more than medium, to be honest.
 
Ok I have a number of posts to reply to so bear with me for a minute.

What minute, what time of timescale are you living in? I've been reading for half an hour through your discussion with Emperorfool!


About your question whether I'm interested in the odds at arriving at a certain amount of hitpoints: no I'm not. I would be interested in knowing the odds whether my unit needs 0 turns to heal or 1 turn to heal. If I move my SOD through enemy territory from city to city, then these values are interesting because they'd show me which units to pick to speed up my offensive. Generally I don't want to stop my entire stack for more than 1 turn to heal. But as you said, it depends on some of the other healing factors so the game could only give me the healing times for the present healing rate. But that would be good enough in many cases, I would like the information.
I guess however that it will be a lot of work for something that might not be used a lot.

A more useful question: why do you and emperorfool think that the info
22,17 HP * 5,6 hits at 55,6%, R=1,25 would be interesting enough that most users (those who play at the average setting) would like to see it. I do like the info from a mathematical point of view as it gives insight into the calculation, but I don't see how I could use the information ingame. In fact, I think it's even less interesting for ingame use than some of the more detailed odds given at the high setting. Would any of you care to explain the use of these figures for gameplay?
The last line in the average setting: defender unharmed might be useful in some rare cases (using weak units to kill a strong one), but will typically also not be used a lot because players rarely employ such a strategy.

By the way, it's starting to look pretty polished. :goodjob:
 
FWIW, I prefer the medium detail level. I think very few will want more than medium, to be honest.

That's what I hope for. I don't want many people to use more than the medium detail level, which is why I'm trying to make it the most obviously helpful level. In fact I might prefer to call it Standard or Recommended detail rather than medium.

I've tried using high detail just browsing around the map and it overwhelms me a tad. But the main thing I appreciate about the two highest levels is being able to do combat experiments.


@EF,
That's looking good. All I'll need to be able to do with them is print them from a float value. Will you be able to pick which block to print depending on a variable rather than a constant?
 
Yes. All that I'll need to do is the integer division by 20 to find how many 20-size blocks to add and then modulo 20 to find which right-end block to add. It's pretty easy given that all it does is build up XML text just like the rest of that function.
 
What minute, what time of timescale are you living in? I've been reading for half an hour through your discussion with Emperorfool!

lol different intertial reference frames maybe? You wouldn't happen to live near a massive body like a black hole would you? :p

I would be interested in knowing the odds whether my unit needs 0 turns to heal or 1 turn to heal.
I'm hoping that for this sort of information you can get a loose estimate by looking at the particular HP probabilities. With a medic, your healing rate in enemy territory will be 15HP. With a M3 medic it would be 30HP. With M3/W3 super medic it would be 45HP IIRC. etc. If you know your base healing rate is 30 for example, then you would be able to see that, in my example above, 17% of the time it would take 1 turn to heal, 32% of the time 2 turns to heal, and so on.

If it would help, I could display odds of some unions. e.g.
P(100HP)
P(100HP or 83HP)
P(100HP or 83HP or 66HP)
...

or equivalently (obviously)
P(0 hits taken)
P(1 hits taken)
P(2 hits taken)
...

or maybe simpler as
100HP:
83HP+:
66HP+:
...

With this last way, you could determine that if you need units to heal in one turn with a 30HP heal rate, then you just look for the odds of the first number above or equal to 70HP and use that probability.

Do you think something like above would be more useful generally?

Alternatively, something like:

(100HP: 5.31%) (>100HP: 0%) (<100HP: 94.69%)
(83HP: 11.80%) (>83HP: 5.31%) (<83HP: 82.89%)
(66HP: 15.71%) (>66HP: 17.11%) (<66HP: 67.18%)

but that's probably getting a bit crazy:mischief:

A more useful question: why do you and emperorfool think that the info
22,17 HP * 5,6 hits at 55,6%, R=1,25 would be interesting enough that most users (those who play at the average setting) would like to see it. I do like the info from a mathematical point of view as it gives insight into the calculation, but I don't see how I could use the information ingame. In fact, I think it's even less interesting for ingame use than some of the more detailed odds given at the high setting. Would any of you care to explain the use of these figures for gameplay?
IMO they are basic enough variables that are so essential to how combat works that they should probably be included at the medium setting. In particular, the R value which I just added, is very important and I plan to refer to it in the Drill Promotions article I'm in the process of making. For example, I intend to recommend that people don't use Drill IV troops to attack unless R is at least 1 and ideally less than 1.33 if they want to earn 3XP.

The number of hits required for each combatant are pretty much what determine the odds, so I feel they're important to see at a glance if I want to know why my odds are so bad or so good. I have to agree the damage per hit is not quite as useful information, but this is also why I have this information at the bottom.

The last line in the average setting: defender unharmed might be useful in some rare cases (using weak units to kill a strong one), but will typically also not be used a lot because players rarely employ such a strategy.

By the way, it's starting to look pretty polished. :goodjob:

I agree with the Defender Unharmed not being useful too frequently, and I think I will remove it from the medium setting following your comment. The only reason I might keep it there is for symmetry's sake.
 
I'm hoping that for this sort of information you can get a loose estimate by looking at the particular HP probabilities.

.
.
.

but that's probably getting a bit crazy:mischief:

Hmm. Yeah that could work somewhat. But to be honest, I don't think I'd use it when I'd still need to do some calculations. There are too many units to scan to see which one would work best. And to be honest, I have done some rough calculations in my head in the past and I do have a good gut feeling about which one would work best so I probably wouldn't use it anyhow. If I'd want to check my gut feeling, I could use the higher settings.


IMO they are basic enough variables that are so essential to how combat works that they should probably be included at the medium setting. In particular, the R value which I just added, is very important and I plan to refer to it in the Drill Promotions article I'm in the process of making. For example, I intend to recommend that people don't use Drill IV troops to attack unless R is at least 1 and ideally less than 1.33 if they want to earn 3XP.

The number of hits required for each combatant are pretty much what determine the odds, so I feel they're important to see at a glance if I want to know why my odds are so bad or so good. I have to agree the damage per hit is not quite as useful information, but this is also why I have this information at the bottom.

You know, these are the reasons why I'd like to see them as a mathematician. But would it really help the gameplay and tactics of various players? I don't see how.


I agree with the Defender Unharmed not being useful too frequently, and I think I will remove it from the medium setting following your comment. The only reason I might keep it there is for symmetry's sake.

Yeah, symmetry is important! :D

By the way, I don't want to sound too critical. It's a great modcomponent and I'll happily use it. I just give my opinion and want to hear yours to see how this mod component can become the best it can be.
 
Top Bottom