Guess the map 16: No need for that latitude!

It's interesting how the MENA region (Middle East and North Africa) appears so clearly on the map. I wonder how that relates to vegetation.
 
Geography or climate related?
As a first hint this is how climate related it is. The bars show the amount of the variance attributable to climate, with the grey bat showing the amount of the difference that is climate related. This is for multiple different group comparisons.

ALFvGGx.png
 
So that did not help at all? How about the difference over time, with the effect of geography as well.

itFszbV.png
 
There was the desertification of the Sahara some 6000 years ago.
 
There was the desertification of the Sahara some 6000 years ago.
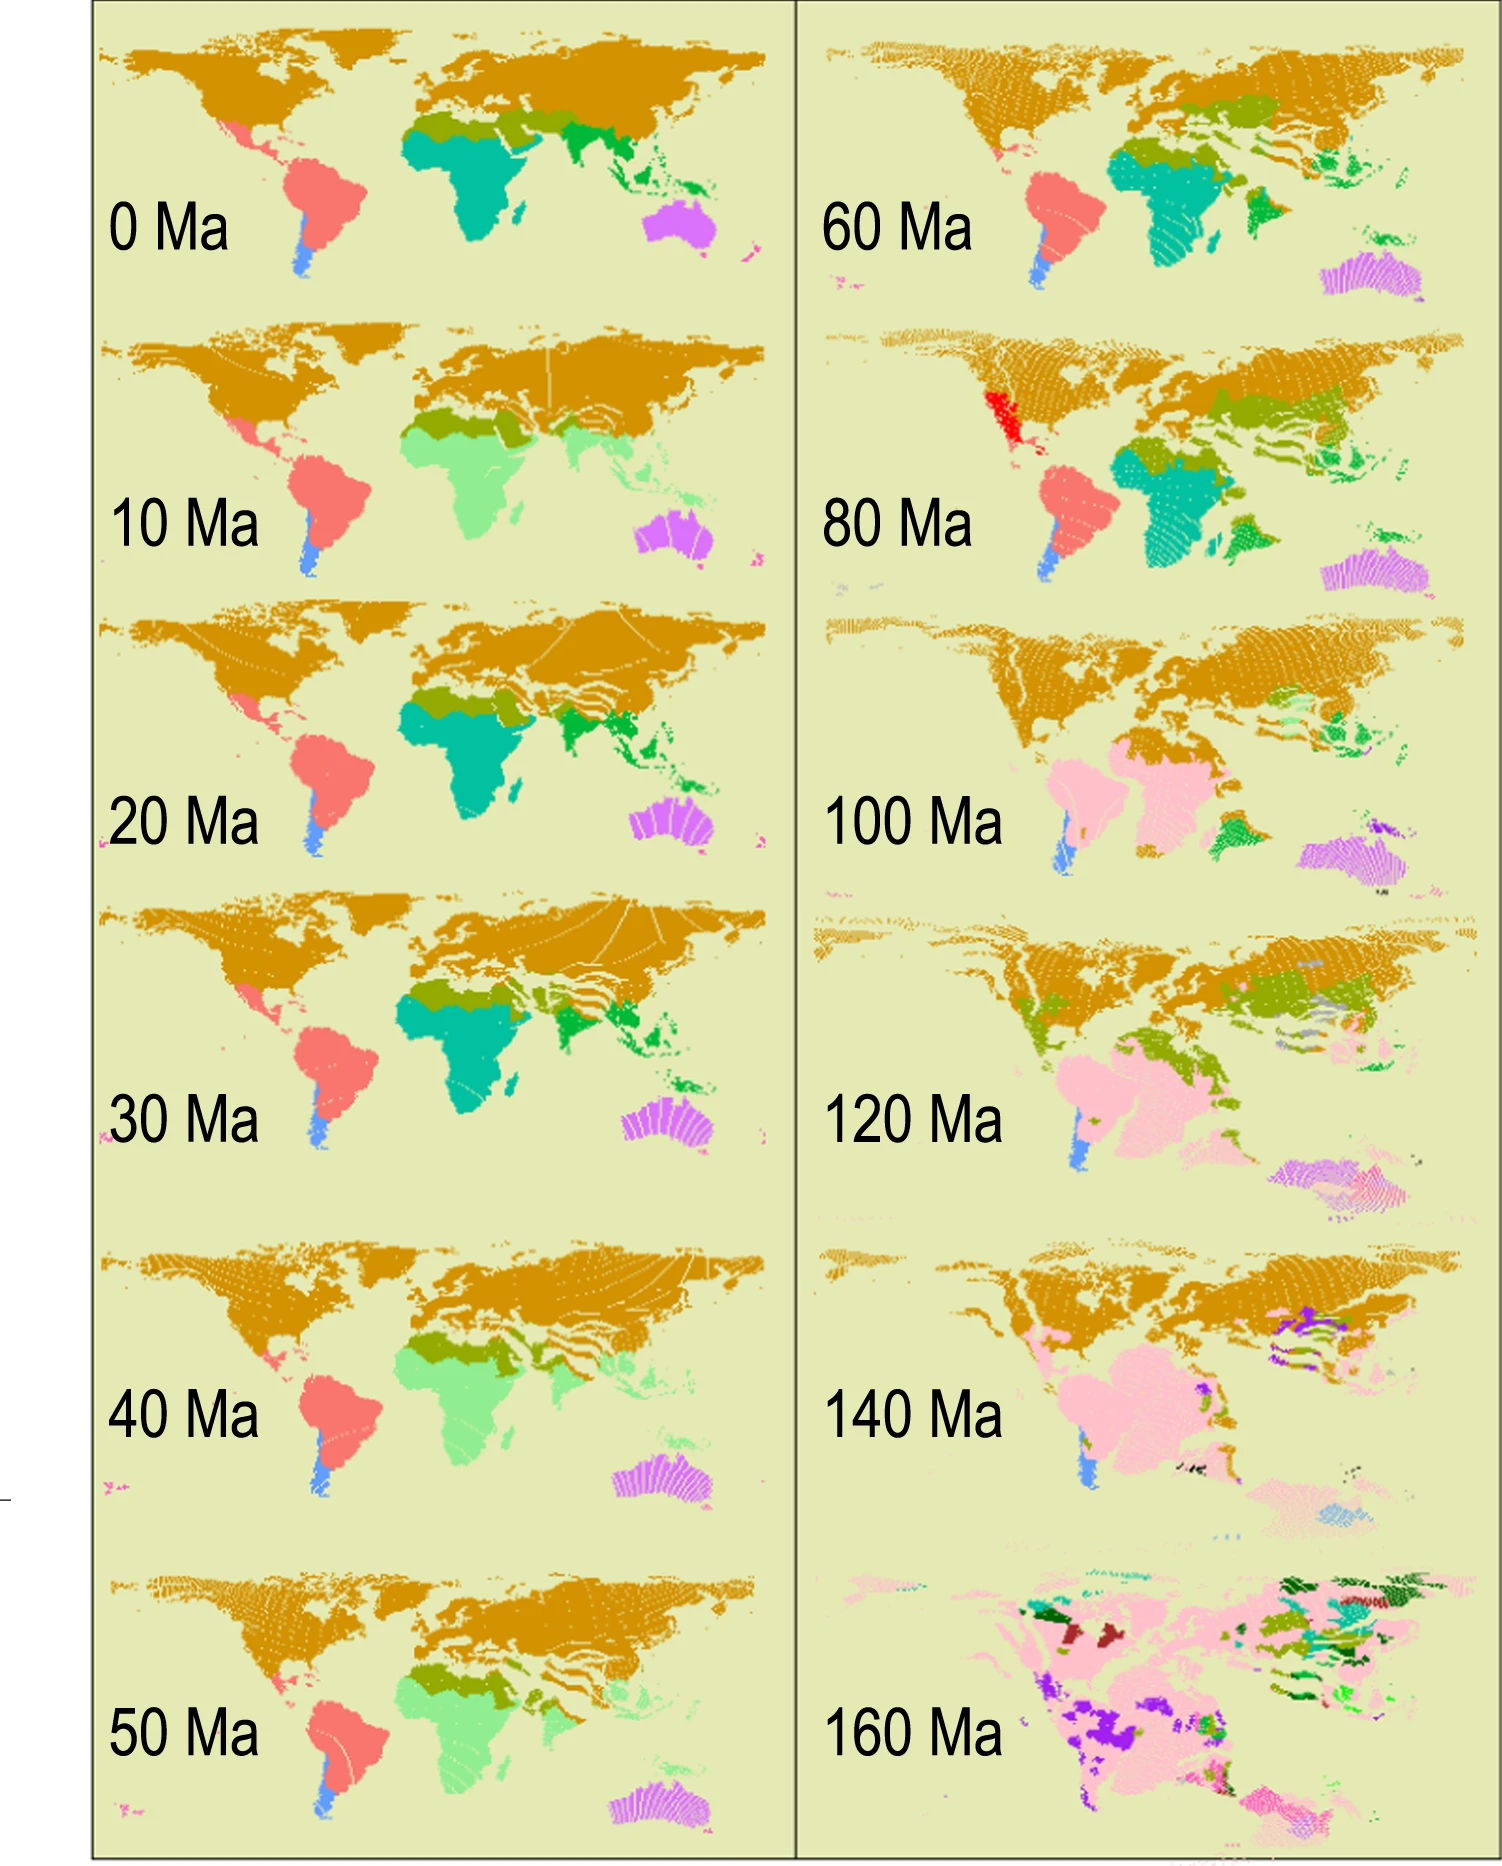
Do you understand how that would register on the above graphs? The first thin little purple coloured section marked "Q" is the Quaternary, which started about 2 1/5 million years ago.
 
prevalent type of trees? using some genetic analysis for "likeness"?
With the graphs being driving factors for diversification.
 
prevalent type of trees? using some genetic analysis for "likeness"?
With the graphs being driving factors for diversification.
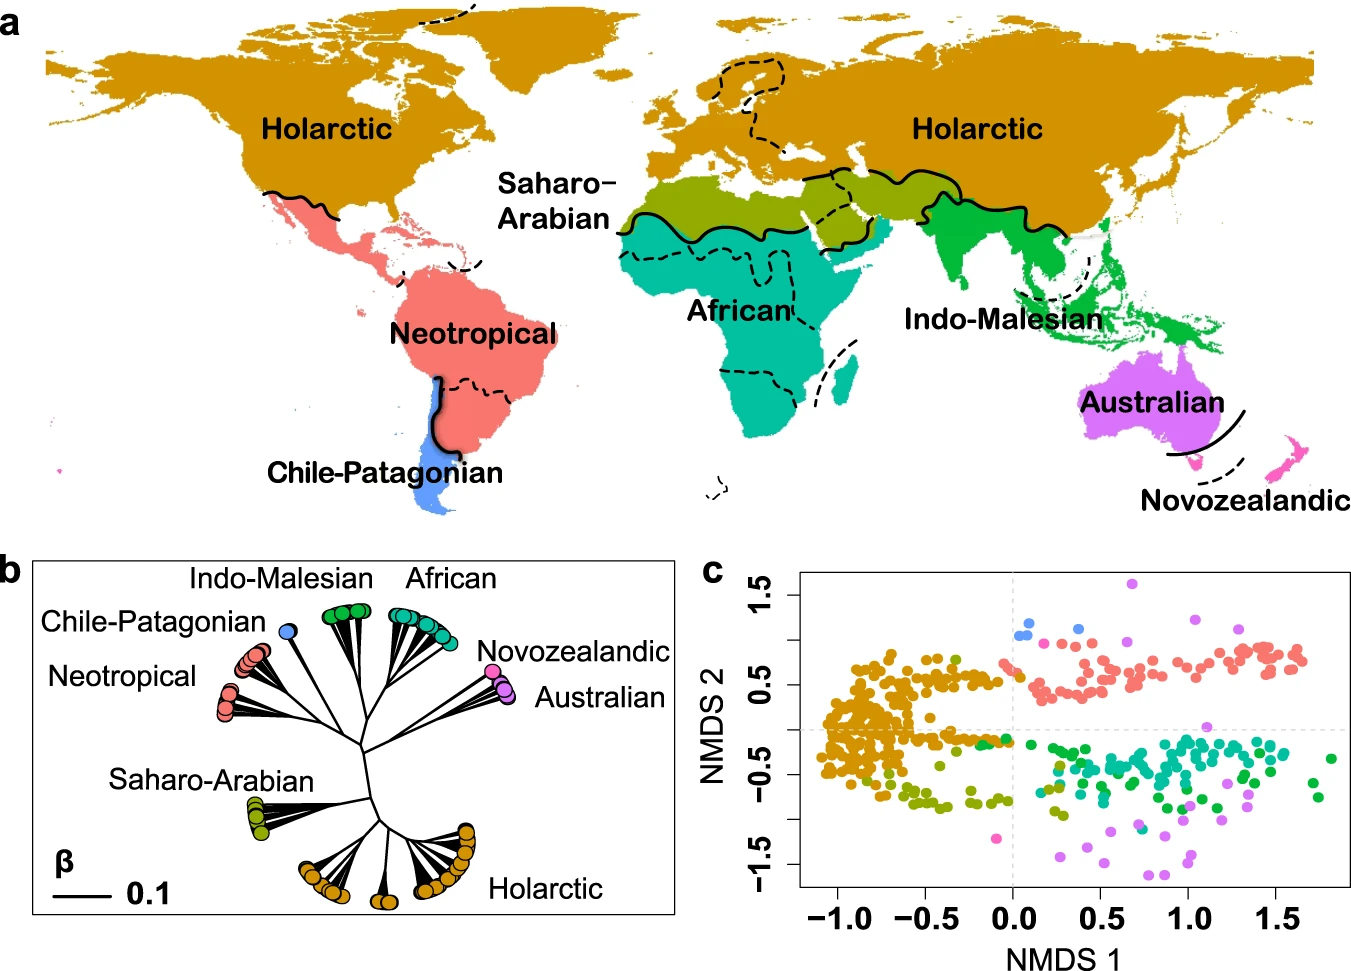
I think that has to be close enough. It is more correctly prevalent type of plant using some genetic analysis for "likeness". Otherwise known as a floristic map of the world.

41467_2023_38375_Fig1_HTML.png

Spoiler Legend :
a Boundaries of the eight floristic realms and 16 sub-realms are shown in solid and dashed lines, respectively. b The unrooted dendrogram depicts the relationships among floristic realms evaluated using UPGMA clustering method based on phylogenetic beta diversity between realms. The scale bar in the dendrogram shows the dissimilarity between realms. c The scatter plot shows the dissimilarities in the phylogenetic compositions between different geographic standard units (GSU) generated using non-metric multidimensional scaling (NMDS) ordination. Each tip in the dendrogram and each point in the scatter plot represents a geographic standard unit and the colors indicate the floristic realms that they belong to.

I like how it has change over time, though this map is hard to interpret correctly, it is explicitly NOT based on fossils but on the structure of the genetic relationships.

41467_2023_38375_Fig2_HTML.png

Spoiler Legend :
The phylogenetic tree is cut at successive phylogenetic depths and all descendent leaves are collapsed into the branches encountered at that depth. Then the realms at each phylogenetic depth are identified using the same clustering method as in Fig. 1. It is noteworthy that we do not intend to estimate the ancestral geographic ranges of phylogenetic branches. This chronological sequence of maps represents the divergence times of flora that survived to the present day, but it provides only limited information on the ancestral floristic relatedness, which should be evaluated by fossils. The floristic realms which can be matched to the present-day realms are shown in the same colors as shown in Fig. 1a. As the present-day floristic realms are not distinguishable in some historical periods, we used other colors to represent these ancestral floristic realms. Specifically, light green in maps of 10, 40, and 50 Ma represents the ancestral realm covering the geographic ranges of the present-day African and Indo-Malesian realms; pink appearing from 100 Ma to 140 Ma represents the ancestral realms covering the present-day Neotropical+African realms, the present-day Neotropical+African+Indo-Malesian realms, and the present-day Gondwanan super-realm, respectively. Notably, most present-day floristic realms are undistinguishable in 160 Ma.
 
Thanks..ha..i was just gonna edit his post
 
Back
Top Bottom