[RD] Daily Graphs and Charts

Status
Not open for further replies.
Spoiler :
top40.jpg


top40%20300k.jpg


http://www.businessinsider.com/worlds-highest-effective-personal-tax-rates-2013-1
 
2ur569z.jpg


http://www.epi.org/publication/ib333-labor-force-participation-since-great-recession/

- about two thirds of the decline in US labor force participation was in excess of the expected fall based on the 1989 to 2007 trend.
- when these presumably involuntary labor force dropouts due to cyclical factors (i.e. recession and its aftermath) are counted among the unemployed, the 2011 U-3 unemployment rate would be 10.7% as opposed to 8.9%; virtually no improvement since the 2009 trough

Found via Dean Baker's CEPR:
http://www.cepr.net/index.php/blogs/cepr-blog/back-to-full-employment

(great synopsis of US labor force statistics)

Notice especially:

CEPR said:
But even this understates the damage. The December 2007 rates of employment and labor force participation were themselves hangovers from the previous (2001) recession. A better threshold would be that of effectively full employment, akin to the conditions we enjoyed in the late 1990s.

See also:
http://globaleconomicanalysis.blogspot.nl/2012/10/charting-errors-in-bls-participation.html

Which puts the percentage at 76%; painting an even more negative picture.
 
I wonder what superannuation contributions as a percentage of GDP are in Australia. Compulsory retirement saving, replaces pensions for many and would reduce the tax share of GDP.
 
011012krugman1-blog480.jpg


The vertical axis measures the projected ratio of federal debt to GDP. The blue line at the top represents the projected path of that ratio as of early 2011 — that is, before recent agreements on spending cuts and tax increases. This projection showed a rising path for debt as far as the eye could see.

And just about all budget discussion in Washington and the news media is laid out as if that were still the case. But a lot has happened since then. The orange line shows the effects of those spending cuts and tax hikes: As long as the economy recovers, which is an assumption built into all these projections, the debt ratio will more or less stabilize soon.

CBPP goes on to advocate another $1.4 trillion in revenue and/or spending cuts, which would bring the debt ratio at the end of the decade back down to around its current level. But the larger message here is surely that for the next decade, the debt outlook actually doesn’t look all that bad.

http://krugman.blogs.nytimes.com/2013/01/10/the-mostly-solved-deficit-problem/
 
Some electricity market charts showing the impact of renewable energy and carbon pricing (among other things) on electricity generation in Australia.

source here: http://www.pittsh.com.au/documents/201209_ps_cedex_electricity_update.pdf

attachment.php


attachment.php


Basically gas and renewables are replacing black coal through a combination of the merit order effect and the aging and periodic or permament closing of a few coal plants. Brown coal, being much cheaper than black, has been displacing black coal in response to being partially displaced by wind power.

A carbon price was implemented in July 20112 That impact hasn't become entirely apparent but may be responslbe for that final uptick.

The result has been lowering emissions intensity:

attachment.php


Oh and here's the gross levels of gneeration since those are all indexes:

attachment.php


We're still very coal centric.
 

Attachments

  • $76604CCDFA3A1A9E.jpg
    $76604CCDFA3A1A9E.jpg
    29.9 KB · Views: 327
  • $76604CCDFA3A1A9F.jpg
    $76604CCDFA3A1A9F.jpg
    41.1 KB · Views: 327
  • $76604CCDFA3A1A9G.jpg
    $76604CCDFA3A1A9G.jpg
    35.7 KB · Views: 312
  • $76604CCDFA3A1A9D.jpg
    $76604CCDFA3A1A9D.jpg
    40.4 KB · Views: 324
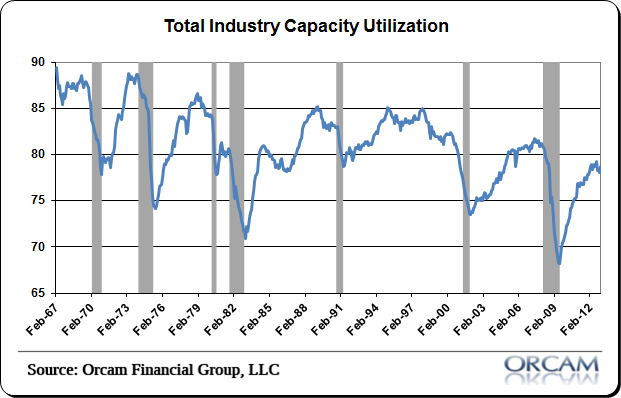
Industrial capacity utilization seems like it would be one of the most daunting things to measure. And even if you go plant by plant and gather up all their outputs, how do you determine what 100% capacity is?
 
There was an article about blue and teal in modern games too. The big budget games obviously did this as well.
 
Status
Not open for further replies.
Back
Top Bottom