Sporaticus
Drooling Barbarian
I would love to see a weekly Settler/Chieftain high-score competition. Call it G-Noob!
*shudder*
I would love to see a weekly Settler/Chieftain high-score competition. Call it G-Noob!
 situation would be radically different, yielding a brand new problem to optimize. I think we've got this one largely figured out.
I hear that. Though I will say that it wouldn't be quite so bad now that we know it can be hammered out in 300 turns or so. We might not even improve every tile!


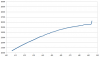
you should post the in game graph of your game score; i'd like to see what a more optimized approach looks like.
Is there a way to get that without having to knock over all the city-states on the final turn again?

Results:
G-Minor XI -Domination, Settler, Standard, Pangaea, Epic, Rome (Highest Score wins!)
1st Martin Alvito 28,960 Points T-375
2nd Tinknade 26,642 Points T-449
3rd vexing 26323 26,323 Points T-494
Congratulations!
The graph is basically a logarithmic:
which produces the counterintuitive result that it can be sensible to quit even in the increasing returns portion of the score graph.


mallow, you should post the replay graph of your game score too