Sinking Chances of Seafaring and Non-Seafaring Civilizations

Ginger_Ale

Lurker
Retired Moderator
Joined
Jul 23, 2004
Messages
8,802
Location
Red Sox Nation
Seafaring vs. Non-Seafaring Civilizations
The Chances of Sinking in Water

I have conducted a study on the chances for ships (my test used curraghs) to sink in water (my test used only ocean, though I am pretty sure the chances are the same for sea). I used 50 curraghs (unless otherwise noted) for a non-Seafaring civilization (Rome) and 50 curraghs (unless otherwise noted) for a Seafaring civilization (England). Below is the raw data and a couple of graphs. If you have any questions, feel free to post in this thread. My conclusion is at the bottom of the thread.

All tests done with Conquests, v1.22.

Notes: % that survived a second turn in water is a % of the ones that survived the first turn. For example, if I lose 10 of my 50 curraghs, I have 40. 80% survived the first turn. If I lose 10 more curraghs the second turn, I lost 10 of my remaining 40, so that's 75%.

Data

Plain Survivability

--Chieftan--
-Non-Seafaring-
Curragh in Ocean: % of survival in turn 1 (% of survival in turn 2)
First try: 54% (% that survived a second turn in ocean: 33% (this one moved a tile))
Second: 46% (% that survived a second turn in ocean: 34.7% (this one moved a tile))
Third: 32% (% that survived a second turn in ocean: 56.25% (this one stayed in the same ocean square))
Fourth: 56% (% that survived a second turn in ocean: 46.4% (this one stayed in the same ocean square))
Fifth: 48% (% that survived a second turn in ocean: 54.2% (this one moved a tile))
Averages: 47.2% for first turn - 44.91% for second turn

-Seafaring-
Curragh in Ocean: % of survival in turn 1 (% of survival in turn 2)
First try: 70% (% that survived a second turn in ocean: 68.6% (this one moved a tile))
Second: 72% (% that survived a second turn in ocean: 61.1% (this one moved a tile))
Third: 72% (% that survived a second turn in ocean: 86.1% (this one stayed in the same ocean square))
Fourth: 76% (% that survived a second turn in ocean: 81.5% (this one stayed in the same ocean square))
Fifth: 74% (% that survived a second turn in ocean: 75.6% (this one moved a tile))
Averages: 72.8% for first turn - 74.58% for second turn

--Monarch--
-Non-Seafaring-
Curragh in Ocean: % of survival in turn 1 (% of survival in turn 2)
First try: 50% (% that survived a second turn in ocean: 36% (this one moved a tile))
Second: 60% (% that survived a second turn in ocean: 53.3% (this one moved a tile))
Third: 48% (% that survived a second turn in ocean: 37.5% (this one stayed in the same ocean square))
Fourth: 50% (% that survived a second turn in ocean: 64% (this one stayed in the same ocean square))
Fifth: 46% (% that survived a second turn in ocean: 39.1% (this one moved a tile))
Averages: 50.8% for first turn - 45.98% for second turn

-Seafaring-
Curragh in Ocean: % of survival in turn 1 (% of survival in turn 2)
First try: 82% (% that survived a second turn in ocean: 80.4% (this one moved a tile))
Second: 66% (% that survived a second turn in ocean: 72.72% (this one moved a tile))
Third: 76% (% that survived a second turn in ocean: 76.3% (this one stayed in the same ocean square))
Fourth: 74% (% that survived a second turn in ocean: 72.9% (this one stayed in the same ocean square))
Fifth: 82% (% that survived a second turn in ocean: 60.9% (this one moved a tile))
Averages: 76% for first turn - 72.64% for second turn

Tests of Terrain and Ship Type

--Regent--
-Non-Seafaring-
Galley in Sea: % of survival in turn 1 (% of survival in turn 2)
First try: 60% (% that survived a second turn in sea: 50% (this one moved a tile))
Second: 58% (% that survived a second turn in sea: 48.2% (this one moved a tile))
Third: 44% (% that survived a second turn in sea: 54.54% (this one stayed in the same tile))
Averages: 54% for the first turn - 50.9% for the second turn

Caravel in Ocean: % of survival in turn 1 (% of survival in turn 2)
First try: 62% (% that survived a second turn in ocean: 35.5% (this one moved a tile))
Second: 56% (% that survived a second turn in ocean: 35.7% (this one moved a tile))
Third: 52% (% that survived a second turn in ocean: 50% (this one stayed in the same tile))
Averages: 56.6% for the first turn - 40.4% for the second turn

-Seafaring-
Caravel in Ocean: % of survival in turn 1 (% of survival in turn 2)
First try: 72% (% that survived a second turn in ocean: 86.1% (this one moved a tile))
Second: 76% (% that survived a second turn in ocean: 78.9% (this one moved a tile))
Third: 66% (% that survived a second turn in ocean: 60.6% (this one stayed in the same tile))
Averages: 71.3% for the first turn - 75.2% for the second turn

Graphs


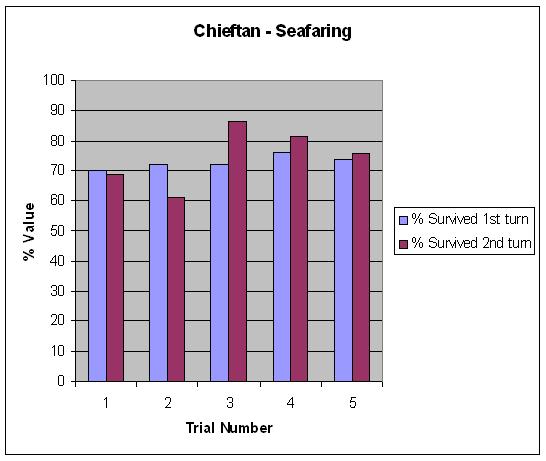
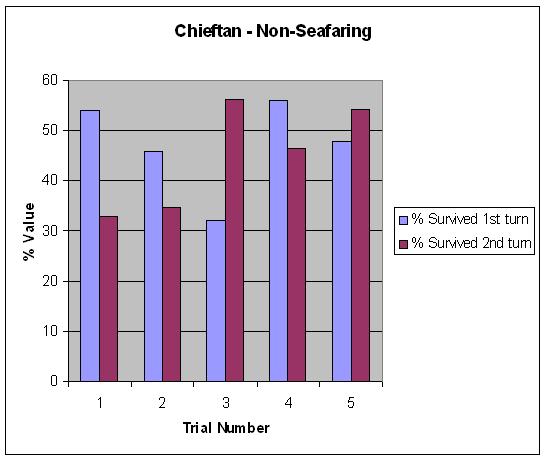
I only did graphs for Chieftan. They are pretty much the same if you do it for the Monarch level tests.

My Conclusion: This appears to be quite simple: there are no other factors besides if you are Seafaring or not. If you are Seafaring, it's 75% of survival, regardless of difficulty level, terrain, ship, turns spent in water. If you are not Seafaring, it's 50%. It might not always been exactly 50% or 75% due to the random number generator, but I would always expect it to be within 15-20%. ;)

Thanks Renata for posing this question in the Quick Answers thread, and I hope you all enjoy the findings. :)
 
Ah. For Astronomy, when you learn how to sail safely in sea tiles, I would assume the percentages will still be the same, except it'll be 100% in sea tiles, ie, you won't sink.

For the Great Lighthouse, the same as Astronomy. I doubt it lowers chances, but I'll check later. It just allows you to sail safely in sea.
 
Nice work, this answers my question from the Quick Answers thread nicely. Except for one thing:
My Conclusion: This appears to be quite simple: there are no other factors besides if you are Seafaring or not. If you are Seafaring, it's 75% of survival, regardless of difficulty level, terrain, ship, turns spent in water. If you are not Seafaring, it's 50%. It might not always been exactly 50% or 75% due to the random number generator, but I would always expect it to be within 15-20%.
[bolding mine]

I'm not sure where you draw the conclusion that the terrain and the ship don't matter. In your post you never mention testing these. Did you casually fool around with these variables and just never formalize a study on them (in which case I'll take your word for it)?
 
No, plarq, I didn't spend 5 turns in water - I did five attempts spending 2 turns in water. But yes, WillJ, I did casually check out those. I'll come up with some data today for it.
 
plarq said:
@WillJ.
He said all that emphasized in your post.
Test on Chieftain and Monarch,terrain Ocean,ship Curragh,turns from 1-5.
Yeah, which means the terrain and ship were held constant.
Ginger_Ale said:
But yes, WillJ, I did casually check out those. I'll come up with some data today for it.
Okay. :)
 
--Regent--
-Non-Seafaring-
Galley in Sea: % of survival in turn 1 (% of survival in turn 2)
First try: 60% (% that survived a second turn in sea: 50% (this one moved a tile))
Second: 58% (% that survived a second turn in sea: 48.2% (this one moved a tile))
Third: 44% (% that survived a second turn in sea: 54.54% (this one stayed in the same tile))
Averages: 54% for the first turn - 50.9% for the second turn

Caravel in Ocean: % of survival in turn 1 (% of survival in turn 2)
First try: 62% (% that survived a second turn in ocean: 35.5% (this one moved a tile))
Second: 56% (% that survived a second turn in ocean: 35.7% (this one moved a tile))
Third: 52% (% that survived a second turn in ocean: 50% (this one stayed in the same tile))
Averages: 56.6% for the first turn - 40.4% for the second turn

-Seafaring-
Caravel in Ocean: % of survival in turn 1 (% of survival in turn 2)
First try: 72% (% that survived a second turn in ocean: 86.1% (this one moved a tile))
Second: 76% (% that survived a second turn in ocean: 78.9% (this one moved a tile))
Third: 66% (% that survived a second turn in ocean: 60.6% (this one stayed in the same tile))
Averages: 71.3% for the first turn - 75.2% for the second turn


This is the new data that proves my point - no graphs for this set of data, sorry. :)
 
Great study. I've always wondered what the chances are. In fact I was thinking about doing some testing myself but you beat me to it :rolleyes:
 
Thanks very much for this.
I somehow assumed that this had been done before, or that it was known.
 
Good study,at least makes sense.
 
ahhhh!! well it was a great study, but the graphs were disturbing! you must have let excell do it for you (dirty rotten microsoft) and it gave you two different scales for your graph. Thus, I'm sad to say, they are completly incomparable, and thus, a bit useless if they were meant to be compared. I really appriecate the effort to even make a graph and then import it into a website (i'd probably break a few computers trying to do that) but you should try to tell excell to make the second graph go from 0-100 like the first one to make them comparable. Other wise, great job, its very interesting to see these satistics that fraxis refuses to ever tell us
 
Thus, I'm sad to say, they are completly incomparable, and thus, a bit useless if they were meant to be compared.

I think that's a bit strong! The scales are perfectly clear.

1. Excel is good, but it can't read minds. How was it to know that the scale maximum should be 100 unless the user sets the scale manually? It's a simple manual operation if you want to do it!

2. Even I, a lifelong M$-hater, can work out that the seafaring civs had pretty consistent 70% success and the non-seafaring ones came out at 30-50%, with more variation. On the evidence of this very small sample I'd say there's a very strong chance that one probability is double the other, given that most improvements given to Civ3 parameters by the programmers are either 50% or 100%. What more do you need to know?
 
You can't just look at a graph and know where the bar graph ends up, right? So you look to the side to see the scale. And if you are actually paying attention, you'll notice different scales. The graphs are there to assist me proving the point - the data is the main focus.
 
yes, I understand that graphs are theres to help prove the point, not prove it, thats pretty much always the case with graphs- they are just visual representations to give you a more shall I say 'intuitive' interpritation of the graph. And yes, I know you have to look at the scale to find what the bar means, and thats why it is so important to have the two graphs having the same scale- well, at least relitivly important (for nobody has ever died over a wrong scale....to my knowledge). For example, if you have to graphs of say peanuts eaten out of 100 that have completly full bar lines, then you'd think that in both graphs 100 penuts were eaten. But if one graph's scale goes to 100 and one to 50, then they are far from the same- one graph shows 100 peanuts being eaten and one shows 50. So if you want a visual aide for your project, wouldn't you want both graphs to have the same scale so you could see the difference in data? itw to manually change the second graph to 0-60 to 0-100, if you wanted to. it is true they are both correct graphs by themselves, but you can't compare them if the scale isn't the same, which is the fun part (oy the fumes from science class must have effected my brian- I'm calling science fun). So like Alan H reaffirmed, excell isn't a mind reader, so you'll have to figure out hos really not that important in the long run, but if you feel like being a good little scientist :nuke: you can change it like that.
 
Preface: This was originally posted in the thread for a "training" succession game (Emperor NOW). Someone posted a link to the article article above following my post in the game thread. I thought it might be helpful to re-post it here since it is related to the main article. Below is a link to a saved game. If the link does not work, try loading the original post.

Flipping Coins and Suicide Galleys

Some Elementary Probability Theory:

Spoiler :
The sum of all probabilites in a problem is 1 (100%); the probability of an event E (outcome) occuring is P(E)=1-P(not E).

To explain this I'll start with a basic "event", flipping a coin. In flipping a coin you have two possible outcomes: heads and tails. Each event is equally likely to occur: P(Heads)=.5 and P(Tails)=.5. The probability of flipping "heads" is therefore

P(Heads)=1-P(Tails)
P(Heads)=1-(0.5)
P(Heads)=0.5

Now here's where we get into a little probability fun. Let's say we're going to flip that coin twice, instead of just once. I'm going to skip some other probability discussion here and invoke the Special Multiplication Rule. This rule states that for two independent events the probability of both occurring is

P(A&B)=P(A) x P(B)

In other words, your odds of flipping "Heads" twice is

P(Heads & Heads)=P(Heads first flip)*P(Heads second flip)
P(H&H) = 0.5 x 0.5 = 0.25

Likewise, your odds of flipping heads twice is the same as flipping tails twice. Some of you might be thinking "Okay scout, those two probabilities only add up to 0.5". That's right, because there are two other sets of possible outcomes:

P(Heads & Tails)=(P Heads first flip) x P(Tails second flip)=0.5 x 0.5=0.25 ...and...
P(Tails & Heads)=(P Tails first flip) x P(Heads second flip)=0.5 x 0.5=0.25

So here are the sums of the probabilities:

P(Heads & Heads)=0.25
P(Heads & Tails)=0.25
P(Tails & Heads)=0.25
P(Tails & Tails)=0.25

So P(at least one heads toss)= 1-P(no heads tossed) = 1 - 0.25 = 0.75

The sum of the probabilities is one. By now some of you may have started to see the math behind stacking your suicide galleys.


The Gambler's Fallacy

Spoiler :
But first we need to discuss a little rub that some call the gambler's fallacy. Simply put, the gambler's fallacy is the incorrect belief that the liklihood of a random event can be affected by (or predicted by) other independent events. Back to flipping coins:

Applying the gambler's fallacy, a gambler might who flips the first coin heads make the erroneous assertion that the odds of flipping heads again is 0.25. This is incorrect; the trials are independent. The odds of that second coin turning up heads within that trial is still 0.5 (a 50-50 shot).


Let's examine a pair of suicide galleys:

Spoiler :
In applying this to suicide galleys we need to look at the trials collectively, not each independent event. If we send out a pair of suicide galleys, we have 4 possible outcomes:

P(First Sinks & Second Sinks)=0.25
P(First Sinks & Second Survives)=0.25
P(First Survives & Second Sinks)=0.25
P(First Survives & Second Survives)=0.25

As in our coin flipping example, we have three possible outcomes that involve at least one event (the galley surviving). You have a 25% chance that both will sink, and a 75% chance that at least one will survive the first IBT.


Here's what the odds look like for 3 Suicide Galleys:
Spoiler :
If you really want to get into the probabilities behind this, Google search Bernoulli Trials and/or the Binomial Distribution... but if you start with three suicide galleys you end up with probabilities that look something like this:

P(all 3 sink)=0.125
P(1 survives, 2 and 3 sink)=0.125
P(1 sinks, 2 survives, 3 sinks)=0.125
P(1 & 2 sink, 3 survives)=0.125
P(1 & 2 survive, 3 sinks)=0.125
P(1 survives, 2 sinks, 3 survives)=0.125
P(1 sinks, 2 & 3 survive)=0.125
P(all 3 survive)=0.125

Note that there is one overall outcome in which you lose all 3 galleys, and its probability is 0.125 (12.5%). Thus it appears that there is an overall 87.5% chance that at least one suicide galley will survive the IBT. The chance that all three survive is 12.5%, the chance that two survive is 37.5%, and the chance that only one survives is also 37.5%.


Now let's see what things look like with 4 suicide galleys in a stack.

Spoiler :
Your probabilities look like this:

All 4 sink 0.0625
One Survives 0.25
Two Survive 0.375
Three Survive 0.25
All 4 Survive 0.0625
Sum of the odds 1

And your probability distribution looks like this for the first IBT:


(There are 1,000 simulated trials in that chart...)


Now here's where we get into the fun stuff - conditional probabilities.

Spoiler :
This is where we look at what happens after the first IBT. Based on the first set of outcomes, we now have a second set of possibilities, dependent upon the first.

In academic notation, the probability of Event B occurring given that event A has occurred. P(B|A)

If "B" is "Heads" in the second of two coin tosses, and "A" is heads in the first of two coin tosses, then the probability of flipping heads after flipping heads the first time is

P(Heads & Heads) = P(Heads 1) x P(Heads 2) = 0.5 x 0.5 = 0.25

Note that your chances of flipping "heads" a second time is still 0.5, but about half the time you don't get to flip the coin a second time. (Is this starting to sound like suicide galleys yet?)

So let's try 3 suicide galleys. Each galley has a 50-50 chance of sinking, but our overall probabilities look something like this:

First trial:

All 3 sink 0.125
One Survives 0.375
Two Survive 0.375
All Survive 0.125

Based on these probabilities, we don't get another turn at sea with the first outcome.

If only one galley survives, we have another 50-50 shot that we'll be at sea next turn. Since the chances of only having one galley survive are 37.5% to begin with, we now have a 18.75 probability of having another turn at sea, and the same chances of losing that one remaining galley in the IBT.

Our odds start getting better if we have 2 galleys survive. Here we have a 25% chance of losing both, and a 75% chance of having one more turn at sea (at least one of the two galleys survives). Our overall odds of this outcome are .375 (first trial) x .75 (second trial) = 28.13%. This gets added to our 18.75% overall chances from the previous outcome.

There is also the fourth possible outcome from the first trial; having all 3 galleys survive the first IBT. Though there is only a 12.5% chance of this happening in the first place, we end up with an 87.5% chance that at least one of the three will survive another turn at sea. Thus our conditional probability for this outcome is 10.94%.

The positive outcomes of the two trials is to have at least one remaining galley. Adding up these probabilities gives us an overall probability of 56.5% for having at least one galley in the water after 2 IBTs at sea.

Hopefully the little galley captain will have spotted something better than a conditional probability after 2 turns in the ocean.


Here's what it looks like if you send a stack of 4 on a suicide run:

Spoiler :
After the first IBT:

All 4 sink 0.0625
One Survives 0.25
Two Survive 0.375
Three Survive 0.25
All 4 Survive 0.0625

After the 2nd IBT:

Code:
                                          Odds of one 
                  1st IBT      2nd IBT    Surviving
All 4 sink        0.0625         <null>   
One Survives      0.25       x    0.5      0.125  
Two Survive       0.375      x    0.75     0.28125  
Three Survive     0.25       x    0.875    0.21875  
All 4 Survive     0.0625     x    0.9375   0.05859

Sum of the probabilities                   0.6836 (68.4%)

Total probability of having at least one galley survive 2 IBTs is 0.6836 or 68.4% if you send a stack of 4.

A question you may be asking yourself if you've read all this:

Spoiler :
Q: What is the difference between the survival probabilities of 4 stacked galleys versus 4 galleys sent off in different directions?

Socratic Answer: How many times have you seen a single suicide galley sink within sight of another coast? :crazyeye:


"Straight Answer": From a pure probability standpoint there is not much of a difference, until you consider the purpose of a suicide galley in-game.

If the purpose of a suicide galley was to explore a cardinal direction and "bust the fog", then you're theoretically no better off stacking your suicide galleys. That's not the purpose of a suicide galley. The purpose of the suicide galley is to reach another shore; and you want to find that other shore as quickly as possible. A suicide galley that departs the safety of a coastline from a point near its home port can be quickly replaced; a suicide galley that departs after sailing halfway around your home continent cannot be quickly replaced. The purpose of the suicide galley is to make contact; get the boats in the water and get them across the ocean ASAP. That means that they sail into the unknown almost as soon as they are built.


Attached to this post is a little game - I set this up to demonstrate the principles. You've got 4 "DinkyBoats" ready to set sail to the open seas. One thing to note about the game setup - Preserve Random Seed is OFF... so continual reloading of this save should yield different results over a number of reloads.

So take a poke at this... and try different things. Sail the boats in a stack, or send them out one by one. Sail them in different directions, or together. If I was a betting man (and I am) I bet the probabilities I've laid out above will approximate your long term results (after a hundred or so reloads ;) )

Here is a link to the saved game: Hiawatha's Bernoulli Trials
 
@Jokeslayer, Abraxan: Thanks for the compliments. I'm not really sure this rates a standalone article... but I appreciate the sentiments. I do think it builds a bit on what GA wrote, so I think it'll be just fine if I leave it here.
 
Top Bottom