Map Analysis and Optimization with Image Processing and Linear/Binary Programming

ipavkex

Chieftain
Joined
Dec 11, 2021
Messages
4
Starting a progress thread to capture some dev work I'm doing around tools for Civ1.

I've been wanting for a while to use maths & code to answer questions like "where should I place my cities", "what's the optimal size + improvements required for each city given competing neighbors", and "which squares should each city use". I have some background in OR and I work with Excel & code so might as well put all that to something useful like Civ ;)

A few things I want to build and share if useful:

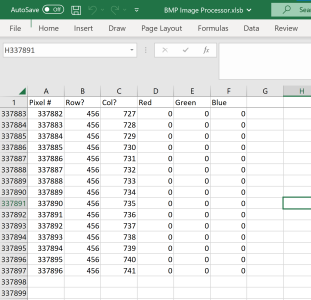
1) a way to get Civ1 map data into a usable format for code to use - I know there's tools like CivEd and others etc that work with .MAP files already so I'll see what's been done there; otherwise a simple image scan of the minimap actually provides most of the base map info (except fishes and special squares);
2) a mathematical model of cities, their improvements, and resulting outputs (taxes, production, bread, citizens);
3) connecting the model to a linear/integer solver like CPLEX to get some answers


What can we get out of this?
1) analysis of theoretical max population & score for any map
2) optimal placement of cities (for max population, caravan routes?)
3) optimal city improvements (eg improvement ABC costs X upfront, Y in maintenance, and returns Z, and is only necessary at city size N - do you really need to build them in ALL cities?)

Stay tuned! all suggestions welcome :)
 
First problem: scanning the minimap image with VBA/Excel to get map data. There are definitely better ways to get .MAP data but I need to practice my image processing skills anyway.

I tried feeding a screenshot of the minimap to http://mkweb.bcgsc.ca/color-summarizer/? but because DosBox runs with a much larger resolution than 320 by 240 (or whatever Civ outputs), the pixel colors blend between each square on the minimap, making a straightforward count of pixels by each color not that accurate.

For example, attached is a BMP image of the minimap of a random Large/Wet/Hot/3By landmass I just generated.

So far I have some VBA code in Excel that reads the BMP file pixel by pixel and stores each pixel's RGB values in the spreadsheet. Takes around 40 seconds to scan the attached 741 by 456 pixel file.

Next up: semi-intelligently determine the boundaries of the minimap (so I don't have to precisely crop the image to the exact rectangle), and then scan the map at the center of each map square (automatically determine pixel-to-square ratio) to get the unique color of that square, which will tell us exactly what the terrain is (why are mountains pink??).

We will need a cleaning step of removing the white viewer box rectangle - I guess we will need to put the viewer box somewhere in the ocean when taking our screenshot, so it doesn't interfere with our terrain scan.

What we should get is a 50*80 (really 48*78 as the very top and bottom rows, and the two ocean columns don't show up) grid of square colors. From there, a simple mapping will tell us how many squares of each terrain any map has. And thus (assuming each square fully improved) how many citizens a map can theoretically feed.

However, from the minimap we cannot tell where the fishes & special squares are - TODO account for this later somehow.
 

Attachments

  • civmap1BMP.bmp
    990.4 KB · Views: 13
  • Excel VBA BMP image processor.png
    Excel VBA BMP image processor.png
    123.3 KB · Views: 16
Sounds like it's not a blocker, but you can run DOSBox at original resolution if you want to, just go into your config file and change windowresolution to 'original' and scaler to 'none' (and obviously run it in a window).

And I'm sure you've seen it already, but the special bonuses are generated via a known algorithm rather than being part of the map itself. It's all documented in a forum post, and is of course all in the JCivEd source code.
 
To complement Lord_Hill's post, note that MAP files are in fact images, in the same format as Civ PIC's files, whose upper 80x50 pixels conveniently represents all map squares, 1 unique color per square type.

You can open those files with JCivEd as images and save them as standard GIFs, maybe easier to process with your tools ?

I could also add a new feature in JCivEd to export maps as text, but can't say when I would have time to release this... in fact I'm wondering whether it's not already possible, but I don't have JCivEd at hand to verify... Will check it up later.

By the way your optimization research sounds cool, I also always wondered about optimal city positions to max out pop/score/etc... :)
 
This is an interesting project, but when you say "theoretical max population & score", do you mean max sustainable population? Because you can go beyond that to increase your score even more, with more overlap of city areas and micromanagement of granary reserves. You can max out one city, fill up its granary and then allow some of its squares to be used by its neighbour to grow and accumulate wheat reserves of its own. This way you can have more population than the land can actually feed--the two cities will be running a food deficit, but with full granaries they would be able to survive for decades without dropping a pop point.
 
I'm not sure if it's useful for you or not, but I have a small tool as part of my recent work that takes a .PIC file (or .MAP save file) and outputs the terrain IDs (single character representation of Forest, Grassland, etc) and includes and special resources as a lowercase character after:


It relies on `npm`/`node` but hopefully it can be useful for you here. Definitely not useful if you want to use optical methods though!
 
Top Bottom