You are using an out of date browser. It may not display this or other websites correctly.
You should upgrade or use an alternative browser.
You should upgrade or use an alternative browser.
[RD] Daily Graphs and Charts II: Another 10,000 to come.
- Thread starter Cutlass
- Start date


Hygro
soundcloud.com/hygro/
Landlines were on their own electrical that only serviced the phone, and nothing else. It's why you could talk when the power was out.What exactly does Felton define as electricity if there's an initial period where more houses have phones than electricity?
Indoor plumbing is missing from that chart, but otherwise it is pretty good.

Abortion Rights Are Advancing Across the Globe | Center for Reproductive Rights
A supplement to the Center's World’s Abortion Laws Map, this report outlines trends in the liberalization of abortion laws over the last 30 years. You’ll
 reproductiverights.org
Paul in Saudi
Emperor
Attachments
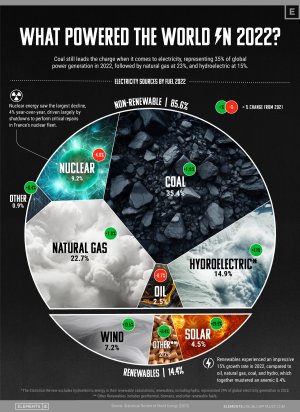
Why have they put hydroelectric in non-renewables?
Paul in Saudi
Emperor
Why have they put hydroelectric in non-renewables?
No idea. I just thought I ought to contribute more around here.
Samez
Emperor
I can only guess, but hydropower can also emit a relevant amount of methane gas due to the decomposition of organic material below the water surface. This seems to be especially relevant if you do not cut down forests before the flooding.

Scientists compiled data from how people around the world allocate their time to define the ‘global human day’. We spend most of our almost 15 waking hours on things that directly affect ourselves and others. The remaining time goes to changing the physical world (activities as wide-ranging as farming, cleaning, manufacturing and construction) and less tangible activities such as government work, retail and transportation. - Scientific American
stfoskey12
Emperor of Foskania
You can really see the effect of the Great Depression on adoption of automobiles, telephones, and electricity. Radio and refrigerators seem unaffected however. I'm not sure why there's a dip in clothes washers later, in the 1940s. I agree with birdjaguar that indoor plumbing would be interesting to see, so would water heaters.
I assumed that was a switch from factories building clothes washers to building tanks.I'm not sure why there's a dip in clothes washers later, in the 1940s.
Spoiler 2.8 MB Chart of global nukes :

Last edited:
stfoskey12
Emperor of Foskania
For better or worse, the US has become a net exporter of petroleum since 2020. I feel like it's probably worse for the environment but better geopolitically.

Similar threads
- Replies
- 77
- Views
- 3K
- Replies
- 3K
- Views
- 96K