Interesting Histograph Screenshot.

Falcon02

General
Joined
Dec 11, 2001
Messages
3,100
Location
Maryland, USA
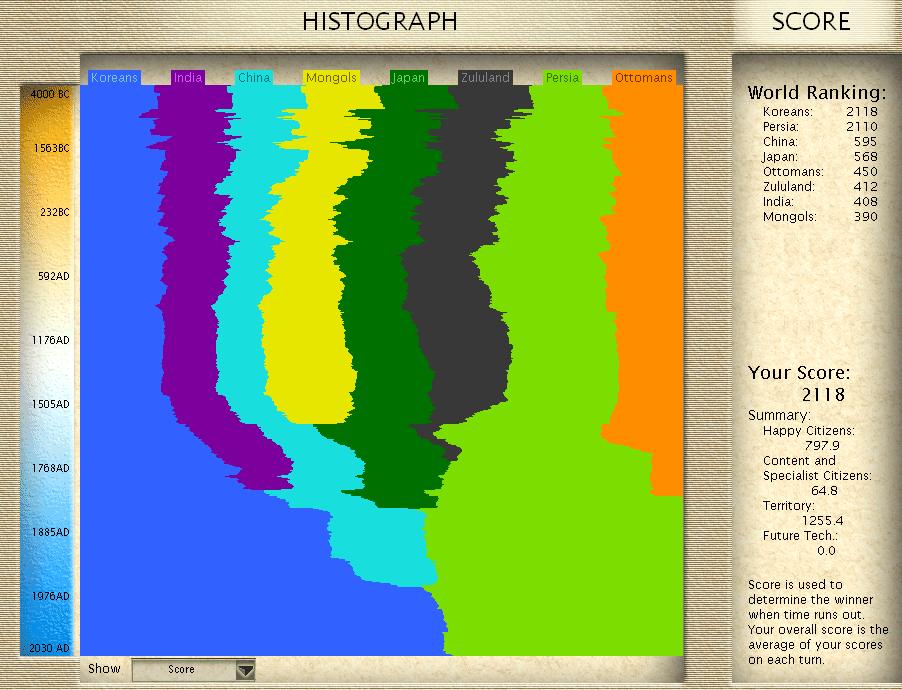
This is an interesting Histograph phenomonon I stumbled upon. Earlier, I was behind in the Score race though catching up quickly, while in the graph my score took up well over 50% of the space, even though I was still behind.

I didn't get a screenshot of that, but below is a screenshot of a later graph, where I was only 8 points ahead of the Persians (only other civ) but my part of the graph takes up about 2/3 of the graph, even though I should only take up about 51% of the graph.

Because of this, I think the graph is based on "Points per turn" compared to others not the actual scores. I could be wrong, but it doesn't seem to be a direct representation of the scores to the right of the graph.

This may have been discovered a long time ago (I'm still learning), and if it was I'm sorry, but this at the very least this is news to me.

interesting_Histograph.jpg
 
The only sensible thing to me would be for it to be "points per turn." Don't know much about the histograph though.... I normally just use it to check how many points I have and that's it.
 
The score number listed on the right is the average of all your scores for every turn in the game, which is why the extinct civs still have numbers next to them. The Histograph shows the current score for each turn.

Going into calculus-type math here: The numbers of pixels taken up by each color should be proportional to the numbers on the right side. For example, if the red score is twice as high as the white score, the red should take up twice as much space on the histograph.
 
Originally posted by QwertySoft
The score number listed on the right is the average of all your scores for every turn in the game, which is why the extinct civs still have numbers next to them. The Histograph shows the current score for each turn.

Going into calculus-type math here: The numbers of pixels taken up by each color should be proportional to the numbers on the right side. For example, if the red score is twice as high as the white score, the red should take up twice as much space on the histograph.

The math seems about right, but doesn't fit in with the screenshot.... He only has 8 more points than the 2nd place person... that's hardly double ;).
 
I think Qwerty is right, The Area of the two portions seem roughly equal (over the entire graph, calculas as he said, "area under the graph").

The Average thing is also supported by the fact that in my current save 2036AD China now has 588 as apposed to 595, going down 7 points because China has had a score of 0 for those turns, thus making the accumulated average decrease.
 
The math seems about right, but doesn't fit in with the screenshot.... He only has 8 more points than the 2nd place person... that's hardly double .

The bottomost line of the histograph represents the 'current score' which is the most recent value added into the average. The 8 point difference is the difference in the average, not the current score.
 
It looks like Persia was ahead of you into the 1960's. The histograph shows the CURRENT balance of power across the globe. Numerical score is the average between all your turns. Thus, an early lead is more valuable than a late industrial/modern one, as that late in the game the lead you acquire does less for your score OVERALL, because it is averaging into fewer turns.

Later!

--The Clown to the Left
 
Back
Top Bottom