Player stats, sales, and reception speculation thread

  • Thread starter Thread starter user746383
  • Start date Start date
The average number of streamers each month currently for Civ VII is in line with the average number of streamers Civ VI had in its first year - under 10. Which major YouTubers have stopped making Civ content by the way? So you're disregarding Potato McWhiskey's own explanation and applying your own narrative.
Where did you get this data from?
Because I went ahead and checked that claim, and while there arent too many data sources available, one of them that does track such data is Twitchtracker, which paints a different picture than what you claim here.

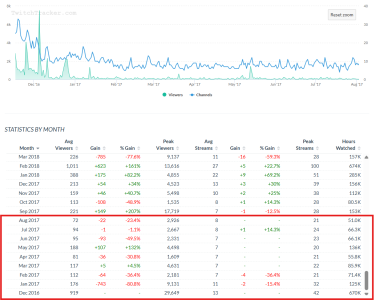
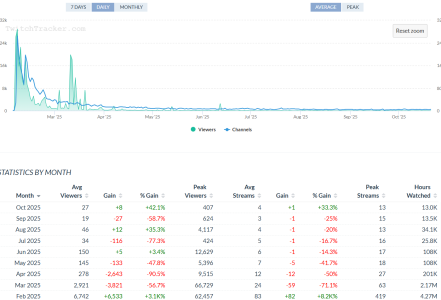
Civ 7, and the first 9 months of twitch streaming data after release:
1761208755084.png

Civ 6, and the first 9 months of twitch streaming data after release:

1761208953321.png
As is very clearly shown and evident from both the graph and the table:
  1. Claiming that "The average number of streamers each month currently for Civ VII is in line with the average number of streamers Civ VI had in its first year - under 10" is dishonest. Yes both are technically "under 10" (number of streams* after the first few months), but this number means nothing in context. Because:
  2. Civ 7 shows that the game suffered a huge drop in both average number of streams, and average number of viewers, suggesting initial hype vastly failed to deliver a stable streaming base amount.
  3. Civ 6 stabilized at a higher base number in both the number of streams (at its lowest point within the first 8-9 months), and the number of viewers, which is evident from the table but also how the graph is much flatter in terms of dropoff. In fact, civ 6 never went below 72 average viewers and 7 average streams (August 2017), whereas civ 7 dropped to 19 average viewers and 3 average streams at its lowest (September 2025). Meaning that just by the metrics of the number of viewers and number of streams alone, civ is relatively much worse off than civ 6, because it is clearly doing worse post-launch for both metrics.

    *Note: “Average streams” refers to the number of concurrent streams active for that game, not the number of unique streamers. Even so, it’s a reliable proxy for relative popularity over time, since TwitchTracker applies the same methodology across all games.
As for my interpretation of civ youtubers burning out as the money and interest isnt there, well I obviously cant speak for every youtuber. But PotatoMcWhiskey (among the biggest youtubers) has barely made any civ 7 videos in the last moths (3 recently though) and mostly branched out into new games, which is in stark contrast to how his civ 6 videos were gobbled up by the communuty before the release of civ 7.
Another big civ youtuber (Boesthius) also made a video on this particular topic, and even admitted that he was "high on copium" when he hoped that civ 7 would get better earlier this year and initially tried to spin it in a positive way, and is now questioning the future of his channel, saying outright that the chance of him playing civ 7 on the channel is pretty much zero (around 5:50). I made a timestamp on his video below, at the start of when he starts going into it:


The broader trend (based on steam player counts) also reinforces this pattern further, because however you want to spin it, civ 7 is vastly underperforming for steam player counts vis a vis civ 6 and even civ 5.


Sources:
Civ 7 twitch data: https://twitchtracker.com/games/414822821
Civ 6 twitch data: https://twitchtracker.com/games/492553
 
Last edited:
The average number of streamers each month currently for Civ VII is in line with the average number of streamers Civ VI had in its first year - under 10.
Maybe so but what was their combined audience - for Civ VI you had Potato, Boes, VB and TGM all with large audiences and all exclusively streaming Civ VI for probably at least the first 18 months.
 
I wouldn't be so sure that DLC won't keep consuming development resources. If Civ VII follows Civ VIs timeline, then the first expansion would be due end of May 2026, with an announcement in March 2026. That's only 7 months away. GTA VI also launches end of May 2026 which is also under the Take-Two umbrella, so maybe they will launch it at a later date than May 2026. They released 7 Civs as DLC before the first expansion in Civ VI, so far we've had 9 Civs as DLC, maybe they'll release one more pack before a major expansion, with the Ottomans, Iceland and whatever else was spotted in the game files.

Based on what they've delivered to us so far, a patch would be next Tuesday if there is one. They haven't hyped it up so far, so I imagine it will be a smaller one like 1.2.4 in August, or there just isn't one and we will go without an update for the first time in a calendar month. Whatever happens, they said there would be news later this month.
That is what I like about being able to see Firaxis's direction a lot better now. If they announce DLC before the end of the year, I will actually start phasing out as a customer most likely. I have no desire to be a whale for them to snag with collectible DLC and game design put on the back end of development as an afterthought. It would be a shame if my favorite series since childhood went all money hungry and care more about profits than the quality of the franchise, but I have seen it many times now. There are plenty of other titles not doing such poor design that could use my financial support.

As a Civ gamer since 1 I would have no qualms if the franchise ended here.
I do agree with this sentiment. If Civ is just going to become a DLC money pump based on the namesake, the next generation of gamers can just have it, I will just lay it down.
 
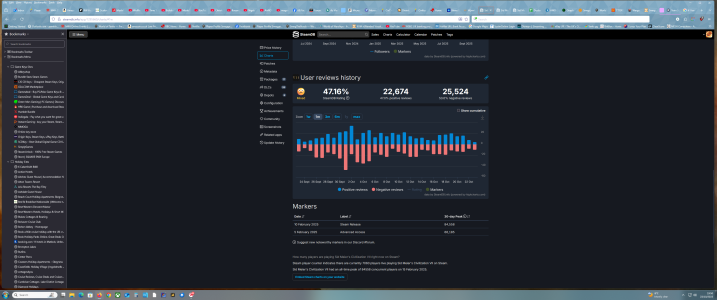
These 4 weeks are 27% of all positive reviews in the first 3 years. I'm not sure why this is. A SteamDB error? Users being prompted to give reviews on Steam? Fake reviews?
You better have some solid evidence to back that up with, if you're gonna claim that the civ 6 data are likely to have been due to an error or even due to "fake reviews".

Also focusing on one week only is irrelevant for the overall broader picture, since even if we ignore that outlier, finishing with a total of 85% positive reviews after 9 years is a very solid number, minimally influenced by one outlier week.
Yes, I have solid evidence, from SteamDB.
  • Amount of positive reviews in those 4 weeks: 14,264
  • Total amount of positive reviews in the first 3 years & 1 month: 53,684
That works out to 27%. When I said error, I meant an error in the way SteamDB collects the data which for some reason would group an overwhelming positive amount in a certain week of November, or an error with Steam itself grouping positive reviews.
That is what I like about being able to see Firaxis's direction a lot better now. If they announce DLC before the end of the year, I will actually start phasing out as a customer most likely. I have no desire to be a whale for them to snag with collectible DLC and game design put on the back end of development as an afterthought. It would be a shame if my favorite series since childhood went all money hungry and care more about profits than the quality of the franchise, but I have seen it many times now. There are plenty of other titles not doing such poor design that could use my financial support.
More overpriced DLC straight after finishing an overpriced DLC pack while the positive reviews are peaking at just 50% would certainly be a choice.
Where did you get this data from?
Because I went ahead and checked that claim, and while there arent too many data sources available, one of them that does track such data is Twitchtracker, which paints a different picture than what you claim here.

As is very clearly shown and evident from both the graph and the table:
  1. Claiming that "The average number of streamers each month currently for Civ VII is in line with the average number of streamers Civ VI had in its first year - under 10" is dishonest. Yes both are technically "under 10" (number of streams* after the first few months), but this number means nothing in context. Because:
  2. Civ 7 shows that the game suffered a huge drop in both average number of streams, and average number of viewers, suggesting initial hype vastly failed to deliver a stable streaming base amount.
  3. Civ 6 stabilized at a higher base number in both the number of streams (at its lowest point within the first 8-9 months), and the number of viewers, which is evident from the table but also how the graph is much flatter in terms of dropoff. In fact, civ 6 never went below 72 average viewers and 7 average streams (August 2017), whereas civ 7 dropped to 19 average viewers and 3 average streams at its lowest (September 2025). Meaning that just by the metrics of the number of viewers and number of streams alone, civ is relatively much worse off than civ 6, because it is clearly doing worse post-launch for both metrics.

    *Note: “Average streams” refers to the number of concurrent streams active for that game, not the number of unique streamers. Even so, it’s a reliable proxy for relative popularity over time, since TwitchTracker applies the same methodology across all games.
As for my interpretation of civ youtubers burning out as the money and interest isnt there, well I obviously cant speak for every youtuber. But PotatoMcWhiskey (among the biggest youtubers) has barely made any civ 7 videos in the last moths (3 recently though) and mostly branched out into new games, which is in stark contrast to how his civ 6 videos were gobbled up by the communuty before the release of civ 7.
Another big civ youtuber (Boesthius) also made a video on this particular topic, and even admitted that he was "high on copium" when he hoped that civ 7 would get better earlier this year and initially tried to spin it in a positive way, and is now questioning the future of his channel, saying outright that the chance of him playing civ 7 on the channel is pretty much zero (around 5:50). I made a timestamp on his video below, at the start of when he starts going into it:


The broader trend (based on steam player counts) also reinforces this pattern further, because however you want to spin it, civ 7 is vastly underperforming for steam player counts vis a vis civ 6 and even civ 5.


Sources:
Civ 7 twitch data: https://twitchtracker.com/games/414822821
Civ 6 twitch data: https://twitchtracker.com/games/492553
I got them from Twitchtracker, as you did.
  1. No, it isn't dishonest. It's a fact. They aren't "technically" under 10. They ARE under 10.
  2. Yes, Civ VII had a huge drop. You'd see a huge drop for Civ VI too if Twitchtracker started collecting dating in October 2016 when Civ VI launched and not in December 2016, 2 months after the released of Civ VI.
  3. Yes, Civ VI stabilised at a higher number of average streams compared to Civ VII has. Both are under 10. Civ VII has been between 3 and 7 steamers. Civ VI 7 or 8 streamers. Both are poor numbers. Yes, Civ VI had more average viewers than Civ VII does now.
It looks like Boesthius only made 8 videos in the year prior to Civ VII, and around 24 videos in the year before that, was he already checked out of YouTube? Potato already explained that the amount of negativity surrounding Civ VII is why he hasn't played or uploaded it as much.

Maybe so but what was their combined audience - for Civ VI you had Potato, Boes, VB and TGM all with large audiences and all exclusively streaming Civ VI for probably at least the first 18 months.
I've rarely watched any of them on Twitch, so you can fill me in the information, but it looks like:
  1. VanBradley started streaming in 2020, so not the first 18 months.
  2. Potato didn't stream VI until 2 years after it released.
  3. TGM started uploading & streaming Civ VI 6 months after Civ VI released.
  4. Boes didn't start streaming VI until Jan 2019, and not regularly until 2020.
Were they streaming on other platforms prior to Twitch? Or under different channel names?
 
Yes, I have solid evidence, from SteamDB.
  • Amount of positive reviews in those 4 weeks: 14,264
  • Total amount of positive reviews in the first 3 years & 1 month: 53,684
That works out to 27%. When I said error, I meant an error in the way SteamDB collects the data which for some reason would group an overwhelming positive amount in a certain week of November, or an error with Steam itself grouping positive reviews.

I didnt point to the numbers, I was referring to evidence of your claim that the outlier was likely due a steamdb error, or worse, that they were "fake reviews".

Also you completely skipped on the broader point, which is that even an outlier like this doesn't change the overall picture for civ 6 reviews, which is very solid even if we removed this outlier entirely.

I got them from Twitchtracker, as you did.
  1. No, it isn't dishonest. It's a fact. They aren't "technically" under 10. They ARE under 10.
  2. Yes, Civ VII had a huge drop. You'd see a huge drop for Civ VI too if Twitchtracker started collecting dating in October 2016 when Civ VI launched and not in December 2016, 2 months after the released of Civ VI.
  3. Yes, Civ VI stabilised at a higher number of average streams compared to Civ VII has. Both are under 10. Civ VII has been between 3 and 7 steamers. Civ VI 7 or 8 streamers. Both are poor numbers. Yes, Civ VI had more average viewers than Civ VII does now.
It looks like Boesthius only made 8 videos in the year prior to Civ VII, and around 24 videos in the year before that, was he already checked out of YouTube? Potato already explained that the amount of negativity surrounding Civ VII is why he hasn't played or uploaded it as much.

No it is in fact dishonest what you are doing here, because whether or not they are "under 10" is irrelevant.
This is extremely selective interpretation of data, because you are making an arbitrary goalpost here by measuring success on whether there are less or more than 10 streams, which is a useless measure by itself without context.

The point I was making is that while they are "under 10" (which is a number that means nothing without context), civ 6 plateaued at both a higher stream count than civ 7 (lowest was 7 for civ 6, while the lowest for civ 7 was 3), and a lower viewer count than civ 7 (72 for civ 6 and just 19 for civ 7).
While both are "poor numbers", you are looking at a doubling in stream counts and more than triple the viewer counts.
And while this particular data point (the lowest recorded number) is a single data point and thus to be taken with a grain of salt since the variance could be high otherwise, the pattern repeats itself for every month and civ 6 consistently outperformed civ 7 for the entire post-release stage.
You simply cant argue that away, civ 7 is performing horribly for streams.

While the drop might have been sharper if based on when twitchtracker started recording data, the fact is that we have no data for this at the moment.
Thus you are making a claim here which perhaps might be plausible, but you have nothing to back it up with.
And in regards to everything else we know about civ 7 (terrible player counts compared to civ 6 and 7, and sharing a similar curve of player count dropoff that matches the curve for the stream count dropoff, as well as the bad reviews), the overall picture is one where civ 7 is doing extremely poorly.

Yes, Boesthius uploaded less in the year before civ 7 because the civ 6 cycle was ending (and civ 7 announced at that stage) — that’s normal before a new release. The fact that he still dropped Civ 7 despite higher upload activity right after its release shows disillusionment, not disengagement from YouTube.
And either way, you are doing the same thing you were accusing me of doing with PotatoMcWhiskey.
You claim that I just made a baseless speculation as to why he more or less stopped doing civ content (fair, he never said that directly, but the context heavily implies it since he likely took a very heavy hit in viewership revenue stream), whereas I pointed you to a video where Boesthius literally says that he was "initially high on copium" about civ 7 and wanted it to succeed (but now won't anymore), and where you are now essentially claiming that what he literally said himself is "probably not true".
So which one is it?
 
Last edited:
These 4 weeks are 27% of all positive reviews in the first 3 years. I'm not sure why this is. A SteamDB error? Users being prompted to give reviews on Steam? Fake reviews?
These 4 weeks are the weeks of Autumn sales, which often provided historically lowest prices. I guess for some reason, people often buy games they had on wishlist on this sale in particular and generally enjoy it.

P.S. BTW. this theory assumes Civ6 had massive amount of units sold on those Autumn sales, but this has no representation on the concurrent player number figure. One more (among many others) reason to think about how this concurrent player number is relevant to anything.
 
Trying to say Civ VII and Civ VI had the same behaviour from twitch viewers is completely dishonest, when Civ VI had more than douoble the moaunt of hours watched

But that is what happens when you are trying to defend something that cvant be defended

Civ VII is BY FAR and the worst Civilization game in terms of how the players received the game, and the closest comparison is Beyond Earth, which isnt exactly a Civilization game, its more a spin off
 
Trying to say Civ VII and Civ VI had the same behaviour from twitch viewers is completely dishonest, when Civ VI had more than douoble the moaunt of hours watched
Yes absolutely.
While you could chalk up a single bad data point (a single month) and claim that the variance of that observation was high and therefore just an outlier, we have several data points (number of months post-release) which all show the same pattern, centered roughly around the same values even (strengthening the pattern).
And the n (number of observations) for the number of viewers is much higher (even across multiple datapoints, aka months post-release), so that we can't chalk that up to being a spurious anomaly.

This is not even cherry picking at this point, its just dishonest and selective use of data (especially considering the review argument with the positivity score being touted as well, which shows that civ 7 performs horribly regardless of how you interpret the data).
 
I didnt point to the numbers, I was referring to evidence of your claim that the outlier was likely due a steamdb error, or worse, that they were "fake reviews".

Also you completely skipped on the broader point, which is that even an outlier like this doesn't change the overall picture for civ 6 reviews, which is very solid even if we removed this outlier entirely.


No it is in fact dishonest what you are doing here, because whether or not they are "under 10" is irrelevant.
This is extremely selective interpretation of data, because you are making an arbitrary goalpost here by measuring success on whether there are less or more than 10 streams, which is a useless measure by itself without context.

The point I was making is that while they are "under 10" (which is a number that means nothing without context), civ 6 plateaued at both a higher stream count than civ 7 (lowest was 7 for civ 6, while the lowest for civ 7 was 3), and a lower viewer count than civ 7 (72 for civ 6 and just 19 for civ 7).
While both are "poor numbers", you are looking at a doubling in stream counts and more than triple the viewer counts.
And while this particular data point (the lowest recorded number) is a single data point and thus to be taken with a grain of salt since the variance could be high otherwise, the pattern repeats itself for every month and civ 6 consistently outperformed civ 7 for the entire post-release stage.
You simply cant argue that away, civ 7 is performing horribly for streams.

While the drop might have been sharper if based on when twitchtracker started recording data, the fact is that we have no data for this at the moment.
Thus you are making a claim here which perhaps might be plausible, but you have nothing to back it up with.
And in regards to everything else we know about civ 7 (terrible player counts compared to civ 6 and 7, and sharing a similar curve of player count dropoff that matches the curve for the stream count dropoff, as well as the bad reviews), the overall picture is one where civ 7 is doing extremely poorly.

Yes, Boesthius uploaded less in the year before civ 7 because the civ 6 cycle was ending (and civ 7 announced at that stage) — that’s normal before a new release. The fact that he still dropped Civ 7 despite higher upload activity right after its release shows disillusionment, not disengagement from YouTube.
And either way, you are doing the same thing you were accusing me of doing with PotatoMcWhiskey.
You claim that I just made a baseless speculation as to why he more or less stopped doing civ content (fair, he never said that directly, but the context heavily implies it since he likely took a very heavy hit in viewership revenue stream), whereas I pointed you to a video where Boesthius literally says that he was "initially high on copium" about civ 7 and wanted it to succeed (but now won't anymore), and where you are now essentially claiming that what he literally said himself is "probably not true".
So which one is it?
You like to put words in my mouth, don't you?

I never claimed they were due to SteamDB error or fake reviews. I asked what the reason could be, and proposed some possible answers. That is not the same as claiming that the overwhelming amount of positive reviews during these weeks was due to x, y or z. Funny how you left out me proposing it could've been users being prompted to give reviews, and decided to focus on an error or fake reviews.

What do you mean overall picture? Do you mean the current rating? The current overall rating is great at 85%+. The overall picture doesn't look as good - it fell from 83% to 66%. Its overall positive rating in 2017 was 57% (14,409 reviews) and in 2018 it was 64% (16,103 reviews). It took 3 years worth of updates and 2 major expansions to take Civ VI from 66% to a 85%+. You make it sound as if the overall picture for Civ VI was always at least good - it wasn't.

No, it isn't dishonest. Stating they both have had under 10 streamers is a fact. You said "almost no one streams it" because in recent months it has had 3 to 7 streamers on average. Well, that means almost no one streamed Civ VI too throughout most of 2017 because that had 7 to 8 streamers on average. That's my point. Civ VI had under 10, Civ VII has under 10.

I never made any claims about baseless speculation. I said Potato already stated his reasons why and asked if Boes had already checked out before Civ VII. 8 videos in the year prior is a small amount. Doesn't matter that the Civ VI cycle was ending. Many people still uploaded Civ VI & Civ VI still had huge interest having its highest average player count on Steam. Many still uploaded Civ V during Civ VI which had its cycle end years before. Maybe he lost interest in Civ VI and YouTube in the year or 2 before Civ VIIs release. I'm not sure why you're quoting me saying "probably not true". I never said those words. You're making things that I've said up.
No definitely I just feel you tend to make things up
Yet you've never said what when I've asked.
These 4 weeks are the weeks of Autumn sales, which often provided historically lowest prices. I guess for some reason, people often buy games they had on wishlist on this sale in particular and generally enjoy it.

P.S. BTW. this theory assumes Civ6 had massive amount of units sold on those Autumn sales, but this has no representation on the concurrent player number figure. One more (among many others) reason to think about how this concurrent player number is relevant to anything.
That's right, but it wouldn't result in 10 to 30 times as many reviews as the 2 week Christmas period which also had the same discount in each of 2016, 2017, 2018 & 2019.
 
Yes absolutely.
While you could chalk up a single bad data point (a single month) and claim that the variance of that observation was high and therefore just an outlier, we have several data points (number of months post-release) which all show the same pattern, centered roughly around the same values even (strengthening the pattern).
And the n (number of observations) for the number of viewers is much higher (even across multiple datapoints, aka months post-release), so that we can't chalk that up to being a spurious anomaly.

This is not even cherry picking at this point, its just dishonest and selective use of data (especially considering the review argument with the positivity score being touted as well, which shows that civ 7 performs horribly regardless of how you interpret the data).
By selective use of data, you mean the most recent data? Talking about the most recent data in a thread dedicated to talking about "Player stats, sales and reception" is not cherry picking, dishonest or a selective use of data.
Trying to say Civ VII and Civ VI had the same behaviour from twitch viewers is completely dishonest, when Civ VI had more than douoble the moaunt of hours watched
Who said that?
 
By selective use of data, you mean the most recent data? Talking about the most recent data in a thread dedicated to talking about "Player stats, sales and reception" is not cherry picking, dishonest or a selective use of data.
It is selective use of data, since by omitting historical data points in your samples, you get very skewed results that shows minor improvement in one metric (such as with your example of review scores, or in terms of player count on steam), which glosses over the trend of these numbers.
This is especially so with the case for player numbers on steam, because they typically vary from month to month.
By looking at the entire trend from release till today, it indicates a declining regression curve that is flattening out at best, and not evidence of making a sustained recovery.

Who said that?
You heavily implied that when you focused on one key metric as being relevant for Twitch, which was the "number of streams being under 10 for both games".
Even if we ignore the number of streams (which we shouldnt, the pattern is clear even there), the viewer count for both games clearly shows that interest in watching civ 7 has gone down the toilet.
 
Last edited:
That's right, but it wouldn't result in 10 to 30 times as many reviews as the 2 week Christmas period which also had the same discount in each of 2016, 2017, 2018 & 2019.
Yes, but there could be different behavior patterns, like games purchased on winter sale as a gift.

Discovering and explaining those patterns is a very interesting task if you're within the company and have all the data. In our case we could only do baseless speculations about the reasons. (Which is totally normal for this thread, though)
 
If we're going to accuse people of being selective, it's best not to be selective ourselves. Especially when the overall picture seems to be that Civ7 is doing worse that Civ6, but not by a completely huge margin.

Net result is that doomsayers and those looking for green shoots alike will be able to find things they can point out in the data and honestly, both are probably valid standpoints...
 
It's official: for the first time since launch, we have had consecutive weeks at 50% positive or above.
  • Week 36: 107 positive, 106 negative, 213 total, 50.2% positive
  • Week 37: 101 positive, 101 negative, 202 total, 50% positive
Where are you plucking these figures from?
The cloud perhaps?
If you count up 7 day blocks over the last monthly figures in the graphs.
Monday 29 Sept to Sunday 5 Oct, 148 positive, 208 negative.
Monday 6 Oct to Sunday 12 Oct, 125 positive, 119 negative.
Monday 13 Oct to Sunday 19 Oct, 93 positive, 110 negative.

So, that's the last full 3 weeks Monday to Sunday on the graph, and we only have 1 week where there were more positive than negative reviews, and then it was only 6 more.
You should note that yes, 6th to 12th Oct had 6 more positive reviews than negative ones.
But the following week, 13th to 19th Oct had 7 more negative reviews than positive ones.
If you add up both positive over negative reviews over the last month, you still end up with more negative ones.

This is why its a waste of time trying to go by the number of reviews on a weekly basis.
Its the total number of reviews and the monthly player count that counts.
Its still 53% negative, and its been that way for months.
 

Attachments

  • Screenshot 2025-10-23 19.50.50.png
    Screenshot 2025-10-23 19.50.50.png
    629.4 KB · Views: 8
It is selective use of data, since by omitting historical data points in your samples, you get very skewed results that shows minor improvement in one metric (such as with your example of review scores, or in terms of player count on steam), which glosses over the trend of these numbers.

You heavily implied that when you focused on one key metric as being relevant for Twitch, which was the "number of streams being under 10 for both games".
Even if we ignore the number of streams (which we shouldnt, the pattern is clear even there), the viewer count for both games clearly shows that interest in watching civ 7 has gone down the toilet.
What? What historical data am I omitting in my samples? I've compared the recent reviews and player counts to all data we have. I've literally provided graphs of positive % since release to now to illustrate the recently improved reviews. For example:

1761244951363.png


This is especially so with the case for player numbers on steam, because they typically vary from month to month.
By looking at the entire trend from release till today, it indicates a declining regression curve that is flattening out at best, and not evidence of making a sustained recovery.
Ok? You're arguing against things I've never said. Recently I've said: we had the highest peak of concurrent players in 150 days & we had the best week of average peak concurrent players for 21 weeks. What are you talking about "sustained recovery"? Recovery from September? Or launch? If it's September, then so far October/post 1.2.5 has recovered back to mid May - August levels. If it's recovering back to launch numbers then that is obviously unrealistic right now, every game suffers greatly from player retention after launch. I've said in other comments before that player retention on Steam is right in the middle between Civ VI & Beyond Earth.
You heavily implied that when you focused on one key metric as being relevant for Twitch, which was the "number of streams being under 10 for both games".
It's a fact, I don't understand why you think I'm dishonest for stating an obvious fact. You said it's very telling that barely anyone streams Civ VII. Well, sorry to burst your bubble, but barely anyone streamed Civ VI either in the first year.

Even if we ignore the number of streams (which we shouldnt, the pattern is clear even there), the viewer count for both games clearly shows that interest in watching civ 7 has gone down the toilet.
I agree. The interest in watching Civ VII has decreased greatly. It also decreased greatly for Civ VI. Lets compare the numbers from month 3 (because that is where the data starts for Civ VI) to the data now in month 9:
  • Civ VI Average Viewers - Month 3: 919. Month 9: 95. 89.7% decline
  • Civ VII Average Viwers - Month 3: 278. Month 9: 26. 90.6% decline
  • Civ VI Hours Watched - Month 3: 670. Month 9: 66.1. 90.1% decline
  • Civ VII Hours Watched - Month 3: 201. Month 9: 13.5. 93.3% decline
The numbers are higher for VI, the level of the decline in interest is very similar.
Yes, but there could be different behavior patterns, like games purchased on winter sale as a gift.

Discovering and explaining those patterns is a very interesting task if you're within the company and have all the data. In our case we could only do baseless speculations about the reasons. (Which is totally normal for this thread, though)
Baseless speculation is fine, but in my opinion we can rule out some baseless speculation. The Autumn sale would not result in 1. That amount of reviews and 2. The sheer amount of them being positive. Perhaps all the turkey and cranberry sauce during Thanksgiving had hordes of extremely positive people buying Civ VI.

Where are you plucking these figures from?
The cloud perhaps?
If you count up 7 day blocks over the last monthly figures in the graphs.
Monday 29 Sept to Sunday 5 Oct, 148 positive, 208 negative.
Monday 6 Oct to Sunday 12 Oct, 125 positive, 119 negative.
Monday 13 Oct to Sunday 19 Oct, 93 positive, 110 negative.

So, that's the last full 3 weeks Monday to Sunday on the graph, and we only have 1 week where there were more positive than negative reviews, and then it was only 6 more.
You should note that yes, 6th to 12th Oct had 6 more positive reviews than negative ones.
But the following week, 13th to 19th Oct had 7 more negative reviews than positive ones.
If you add up both positive over negative reviews over the last month, you still end up with more negative ones.

This is why its a waste of time trying to go by the number of reviews on a weekly basis.
Its the total number of reviews and the monthly player count that counts.
Its still 53% negative, and its been that way for months.
SteamDB.
  1. 10/09 - 21 positive, 8 negative
  2. 10/10 - 18 positive, 14 negative
  3. 10/11 - 22 positive, 17 negative
  4. 10/12 - 15 positive, 23 negative
  5. 10/13 - 11 positive, 23 negative
  6. 10/14 - 12 positive, 10 negative
  7. 10/15 - 8 positive, 11 negative
That's the first week. 107 positive, 106 negative, 213 total, 50.2% positive.
  1. 10/16 - 7 positive, 18 negative
  2. 10/17 - 17 positive, 18 negative
  3. 10/18 - 18 positive, 19 negative
  4. 10/19 - 20 positive, 11 negative
  5. 10/20 - 15 positive, 13 negative
  6. 10/21 - 16 positive, 14 negative
  7. 10/22 - 8 positive, 8 negative
That's the second week. 101 positive, 101 negative. 202 total, 50% positive.

14 days in a row. They are both week 36 & week 37 respectively, since launch. Today has seen 4 positive, 10 negative.

If the graph you are referring to is the graph on the Steam reviews, then they don't include Steam reviews of people who purchased the game outside of Steam. SteamDB includes all of them.
 
What? What historical data am I omitting in my samples? I've compared the recent reviews and player counts to all data we have. I've literally provided graphs of positive % since release to now to illustrate the recently improved reviews. For example:

View attachment 745679


Ok? You're arguing against things I've never said. Recently I've said: we had the highest peak of concurrent players in 150 days & we had the best week of average peak concurrent players for 21 weeks. What are you talking about "sustained recovery"? Recovery from September? Or launch? If it's September, then so far October/post 1.2.5 has recovered back to mid May - August levels. If it's recovering back to launch numbers then that is obviously unrealistic right now, every game suffers greatly from player retention after launch. I've said in other comments before that player retention on Steam is right in the middle between Civ VI & Beyond Earth.

It's a fact, I don't understand why you think I'm dishonest for stating an obvious fact. You said it's very telling that barely anyone streams Civ VII. Well, sorry to burst your bubble, but barely anyone streamed Civ VI either in the first year.


I agree. The interest in watching Civ VII has decreased greatly. It also decreased greatly for Civ VI. Lets compare the numbers from month 3 (because that is where the data starts for Civ VI) to the data now in month 9:
  • Civ VI Average Viewers - Month 3: 919. Month 9: 95. 89.7% decline
  • Civ VII Average Viwers - Month 3: 278. Month 9: 26. 90.6% decline
  • Civ VI Hours Watched - Month 3: 670. Month 9: 66.1. 90.1% decline
  • Civ VII Hours Watched - Month 3: 201. Month 9: 13.5. 93.3% decline
The numbers are higher for VI, the level of the decline in interest is very similar.

Baseless speculation is fine, but in my opinion we can rule out some baseless speculation. The Autumn sale would not result in 1. That amount of reviews and 2. The sheer amount of them being positive. Perhaps all the turkey and cranberry sauce during Thanksgiving had hordes of extremely positive people buying Civ VI.


SteamDB.
  1. 10/09 - 21 positive, 8 negative
  2. 10/10 - 18 positive, 14 negative
  3. 10/11 - 22 positive, 17 negative
  4. 10/12 - 15 positive, 23 negative
  5. 10/13 - 11 positive, 23 negative
  6. 10/14 - 12 positive, 10 negative
  7. 10/15 - 8 positive, 11 negative
That's the first week. 107 positive, 106 negative, 213 total, 50.2% positive.
  1. 10/16 - 7 positive, 18 negative
  2. 10/17 - 17 positive, 18 negative
  3. 10/18 - 18 positive, 19 negative
  4. 10/19 - 20 positive, 11 negative
  5. 10/20 - 15 positive, 13 negative
  6. 10/21 - 16 positive, 14 negative
  7. 10/22 - 8 positive, 8 negative
That's the second week. 101 positive, 101 negative. 202 total, 50% positive.

14 days in a row. They are both week 36 & week 37 respectively, since launch. Today has seen 4 positive, 10 negative.

If the graph you are referring to is the graph on the Steam reviews, then they don't include Steam reviews of people who purchased the game outside of Steam. SteamDB includes all of them.
My graph is the one from SteamDB.

You are quoting midweek to midweek figures. You don't start on Thurs 9th Oct and end on 15th Oct, just so you can get more positive reviews.
A week is either Monday to Sunday, or Sunday to Saturday.
Monday 29th Sept to Sunday 5th Oct you get 148 positive, 208 negative.
Monday 6th to Sunday 12th Oct you get 125 positive, 119 negative.
Monday 13th Oct to Sunday 19th Oct you get 93 positive and 110 negative.
The 2nd & 3rd weeks cancel each other out.

Now, I can see that I am wasting my time trying to argue with you.
I will be proved right when we get to the end of October, and there will be more negative than positive reviews for the full monthly period.
But the game was released on February 11, which was a Tuesday. So, it makes sense to compare weeks starting on Tuesdays.
 
My graph is the one from SteamDB.

You are quoting midweek to midweek figures. You don't start on Thurs 9th Oct and end on 15th Oct, just so you can get more positive reviews.
A week is either Monday to Sunday, or Sunday to Saturday.
Monday 29th Sept to Sunday 5th Oct you get 148 positive, 208 negative.
Monday 6th to Sunday 12th Oct you get 125 positive, 119 negative.
Monday 13th Oct to Sunday 19th Oct you get 93 positive and 110 negative.
The 2nd & 3rd weeks cancel each other out.

Now, I can see that I am wasting my time trying to argue with you.
A week is a unit of measurement. 7 days. I've already stated multiple times these are weeks from launch. This is so you can accurately compare to other games.
I will be proved right when we get to the end of October, and there will be more negative than positive reviews for the full monthly period.
:lol:
I've never claimed there would be more positive reviews than negative ones at the end of October. I fully expect there will be more negative ones. As I've already repeated several times, October so far is the best reviewed calendar month since February. But wait, I can't speak about October until October is finished right?
  • Feb - 50.9% (32,635 reviews)
  • March - 43.% (5,583)
  • April - 41.6% (1,912)
  • May - 33.5% (1,770)
  • June - 27.5% (1,928)
  • July - 40.6% (1,293)
  • August - 36.9% (1,386)
  • September - 38.4% (870)
  • October- 46.1% (813)
 
Back
Top Bottom