BNW has been out for over a month now and the source for the DLL has been available in one form or another since last year, and many people are now making their own DLLs for their mods. However, it seems that many don't know how to debug crashes and issues with their mods (especially with DLL changes, which can easily cause crashes). This guide will focus on debugging your mod using Visual Studio's built in debugging features as well as optionally a modcomp to allow you to debug crashes others have using minidumps.
To Begin:
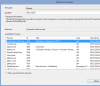
If you want to debug your mod with a custom DLL make sure that you copy the CvGameCoreDLL_FinalRelease2.pdb file to your mod's root directory (the same place the DLL goes) and import that into VFS. This is necessary if you want to attach to the process and debug in real-time. After you do that rebuild the mod and launch civ 5. When you get to the menu screen tab out of it and go back into Visual Studio. In VS (any version, for this demo I'm using VS 2012 Ultimate but it is similar for other versions) and under the Tools menu select 'Attach to Process'. You will see a window similar to this.

Live Debugging:
Select the civ 5 process (for most of us it will be CivilizationV_DX11.exe) and click 'Attach'. Now you will be attached to the game process, but your mod isn't loaded yet so that isn't too useful for now. After that go and load your mod. If you have done everything right with your DLL and PDB you should see the following line in the output window.
Except with your mod's name. This means that VS can now use breakpoints you set in your mod's C++ code. I will now demonstrate an example of this using my mod and some code purposely designed to crash.
To set a breakpoint in Visual Studio click on the left side of the code editor and you will get a red dot on a line of code.
WARNING: I highly recommend that you only debug with Civ 5 in Windowed mode, otherwise you can end up stuck as apps running in fullscreen don't play nice with the Visual Studio debugger.
Now when the program tries to execute that line of code it will break execution there and give manual control to the debugger.
When it does that, you have three main options; Step Over, Step Out and Step into. The first will execute every function on that line and then break at the next line of code in that document. Step Into will go to the function being called (assuming you have the source for that) and break there. Step Out will finish execution of the current function and break when control is given back to the calling function.
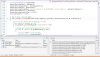
Now I try and use a settler. When I do I will get a popup in VS saying that I got an unhandled exception. Click Break, and you will see something like this.

The code editor will show where your mod just crashed, and you will also get windows for the call stack, local variables, and other debug info. After looking a bit I can see that my call to this function is not properly set up, and I am not ensuring that eCapturingPlayer is not NO_PLAYER. Now I know exactly what caused that crash and what I need to do to fix it. This is incredibly useful for making your mod more stable.
Post-Mortem Debugging:
You can also debug crashes other people have had after the fact using minidumps. I have created a modcomp which will create nice usable minidumps when the game crashes using your mod. Note that this will override Firaxis' default dump creation, so if you have a bug with civ 5 itself and not your mod you might want to disable this modcomp.
To use a minidump, place the CvMiniDump.dmp file (found in the folder where your civ 5 EXE is) in the same folder as your DLL and PDB file, then open it in Visual Studio and click 'Start Debugging'. You will then see a very similar screen to the one you see debugging live, and can see what went wrong with your mod. This is very useful for diagnosing issues end-users of your mod experience, whereas it is far more useful to debug live if you are experiencing the issue yourself.
To Begin:
If you want to debug your mod with a custom DLL make sure that you copy the CvGameCoreDLL_FinalRelease2.pdb file to your mod's root directory (the same place the DLL goes) and import that into VFS. This is necessary if you want to attach to the process and debug in real-time. After you do that rebuild the mod and launch civ 5. When you get to the menu screen tab out of it and go back into Visual Studio. In VS (any version, for this demo I'm using VS 2012 Ultimate but it is similar for other versions) and under the Tools menu select 'Attach to Process'. You will see a window similar to this.
Live Debugging:
Select the civ 5 process (for most of us it will be CivilizationV_DX11.exe) and click 'Attach'. Now you will be attached to the game process, but your mod isn't loaded yet so that isn't too useful for now. After that go and load your mod. If you have done everything right with your DLL and PDB you should see the following line in the output window.
Code:
'CivilizationV_DX11.exe' (Win32): Loaded 'C:\Users\*Your Username*\Documents\My Games\Sid Meier's Civilization 5\MODS\New Horizons (v 1)\CvGameCore_Expansion2.dll'. Symbols loaded.Except with your mod's name. This means that VS can now use breakpoints you set in your mod's C++ code. I will now demonstrate an example of this using my mod and some code purposely designed to crash.
To set a breakpoint in Visual Studio click on the left side of the code editor and you will get a red dot on a line of code.
WARNING: I highly recommend that you only debug with Civ 5 in Windowed mode, otherwise you can end up stuck as apps running in fullscreen don't play nice with the Visual Studio debugger.
Now when the program tries to execute that line of code it will break execution there and give manual control to the debugger.
When it does that, you have three main options; Step Over, Step Out and Step into. The first will execute every function on that line and then break at the next line of code in that document. Step Into will go to the function being called (assuming you have the source for that) and break there. Step Out will finish execution of the current function and break when control is given back to the calling function.
Now I try and use a settler. When I do I will get a popup in VS saying that I got an unhandled exception. Click Break, and you will see something like this.
The code editor will show where your mod just crashed, and you will also get windows for the call stack, local variables, and other debug info. After looking a bit I can see that my call to this function is not properly set up, and I am not ensuring that eCapturingPlayer is not NO_PLAYER. Now I know exactly what caused that crash and what I need to do to fix it. This is incredibly useful for making your mod more stable.
Post-Mortem Debugging:
You can also debug crashes other people have had after the fact using minidumps. I have created a modcomp which will create nice usable minidumps when the game crashes using your mod. Note that this will override Firaxis' default dump creation, so if you have a bug with civ 5 itself and not your mod you might want to disable this modcomp.
To use a minidump, place the CvMiniDump.dmp file (found in the folder where your civ 5 EXE is) in the same folder as your DLL and PDB file, then open it in Visual Studio and click 'Start Debugging'. You will then see a very similar screen to the one you see debugging live, and can see what went wrong with your mod. This is very useful for diagnosing issues end-users of your mod experience, whereas it is far more useful to debug live if you are experiencing the issue yourself.
")
