No silly questions, the UI will be one of the most challenging part of the mod development as there is a lot of data and not so much place on the screen.
This part especially is a WIP, with the formula introduced in a recent patch still in a testing/development phase
The current formula is quite complex, it's this function ("self" is the plot object)
where:
self:GetEmploymentSize() is another function that return a size, as shown below, but using a variable pow and factor per era (where for population size we use a fixed pow = 2.8 and fixed factor = 1000)
Here self:GetRuralEmploymentFactor() and self:GetRuralEmploymentPow() returns the values from the table below, depending on the plot's owner era or the game's average era:
The same kind of formula is used in cities for employment size, maybe with a few difference, I need to check the code, but the table are as follow:
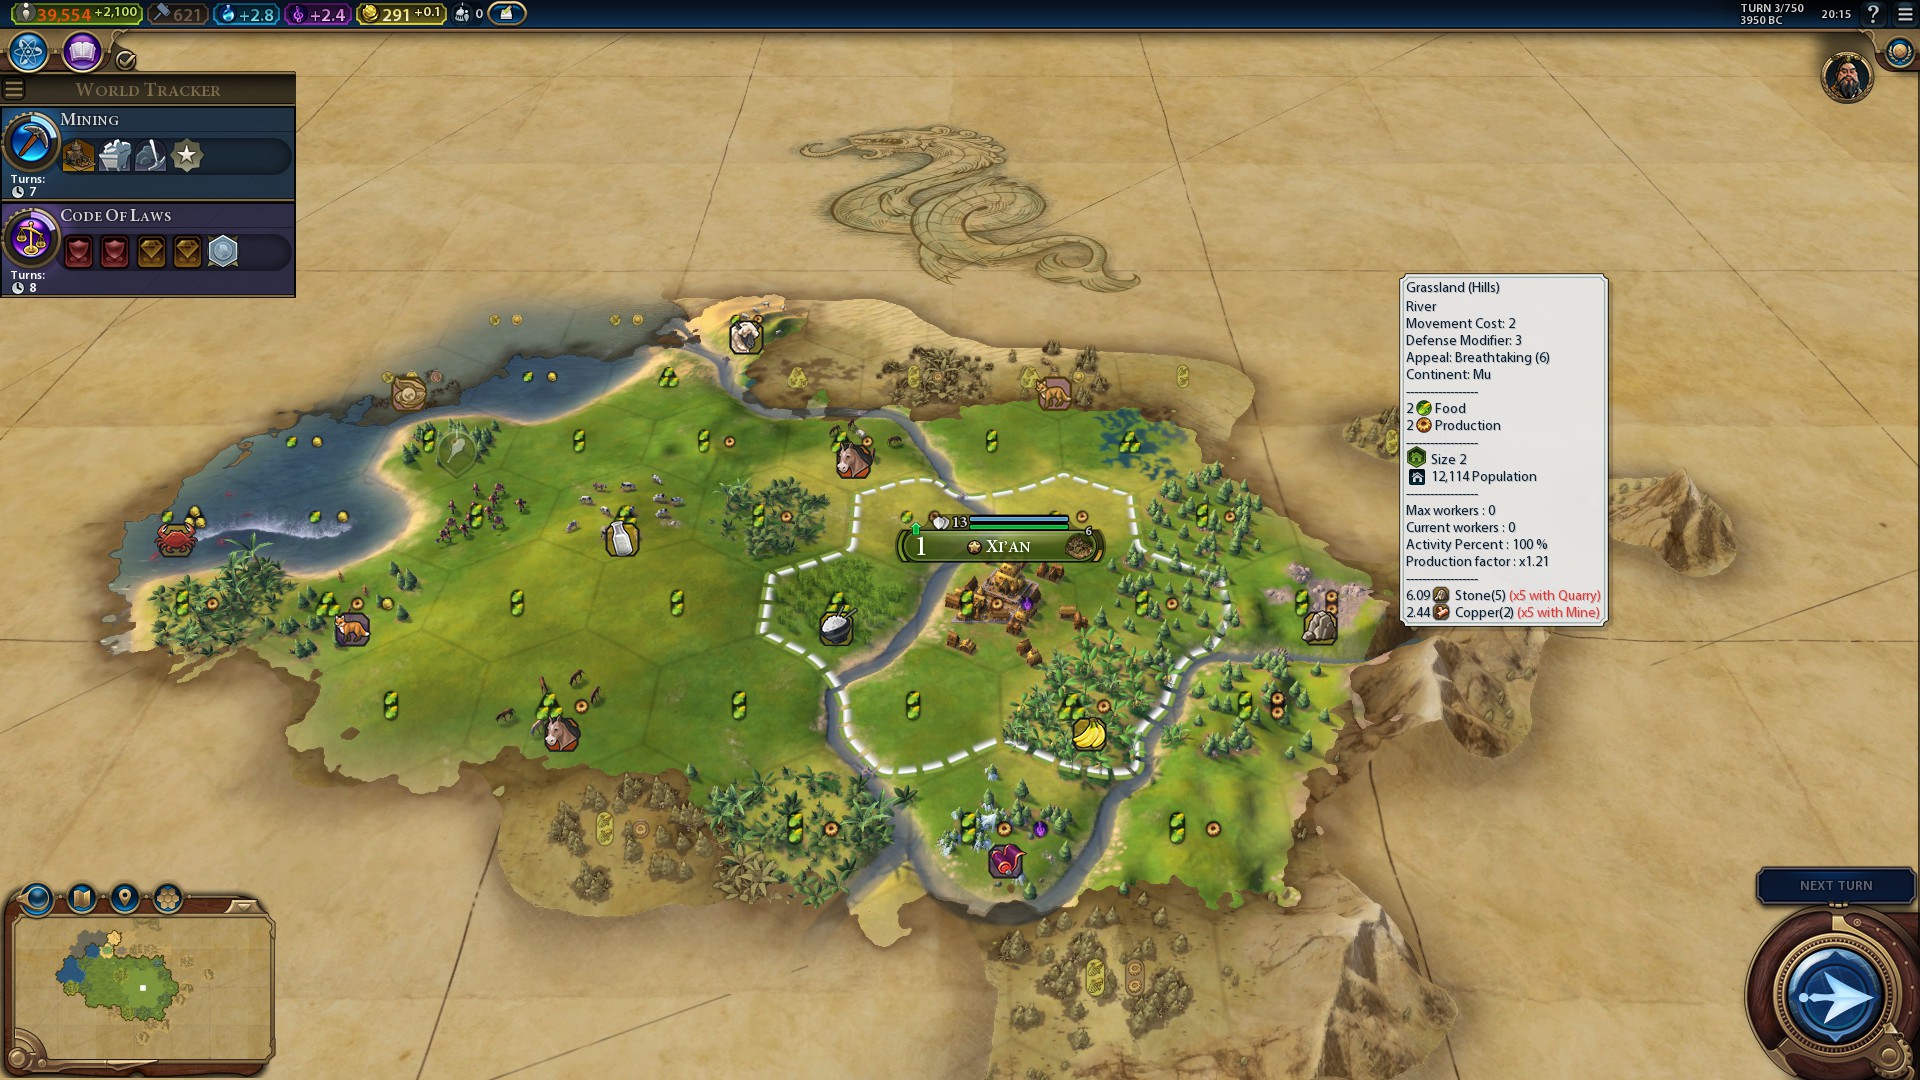
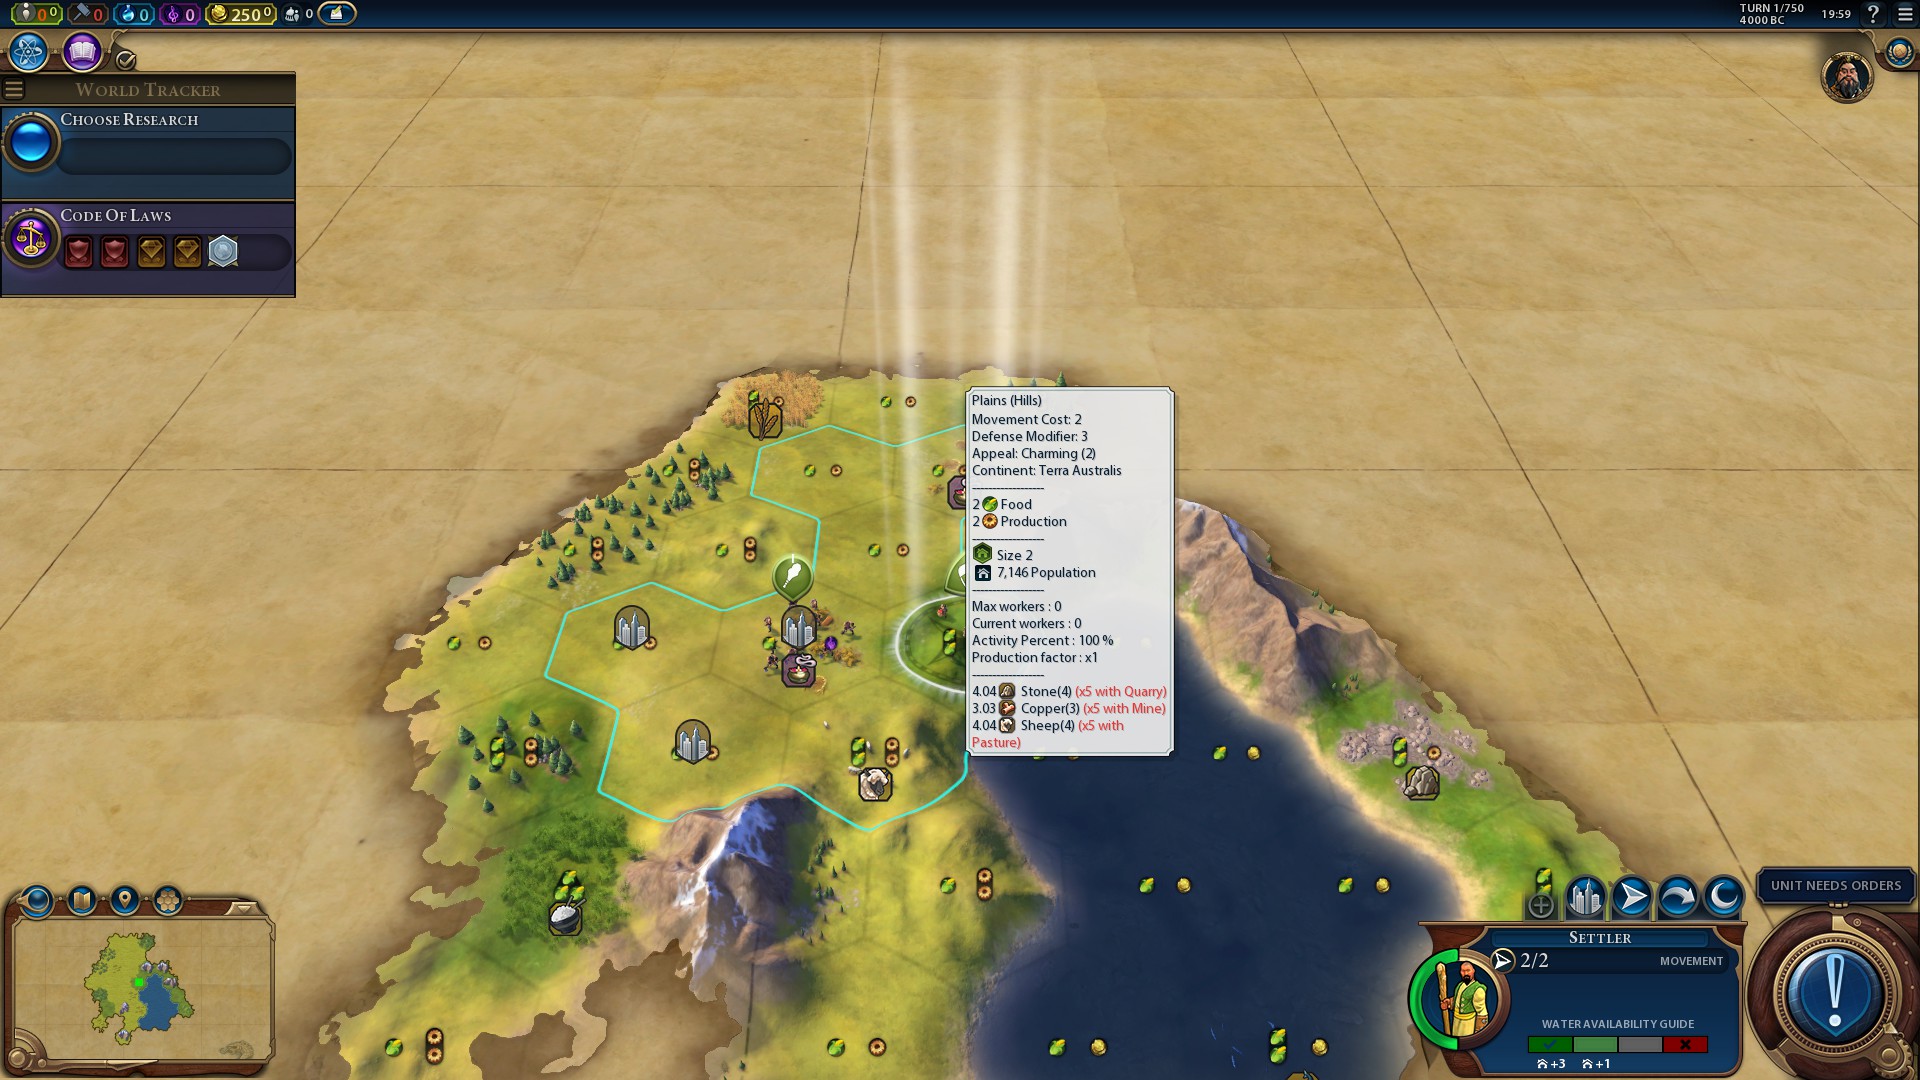
For an example, in your first screen (the second seems broken, it's not shown on my PC), you should have
Production Factor (OutputPerYield)
=
self:GetSize() * self:GetActivityFactor() * PlotOutputFactor[self:GetEraType()]
=
math.pow(29138/1000, 1/2.8) * (self:GetEmploymentSize(29138) / self:GetEmploymentSize(89254)) * PlotOutputFactor[""ERA_ANCIENT""]
=
math.pow(29138/1000, 1/2.8) * (Round(math.pow( 29138 / 1000, 1 / 1.80) / Round(math.pow( 89254/ 1000, 1 / 1/1.80)) * 0.5
= 3.33 * ( 7 / 12 ) * 0.5
= 0.97125
So I'm unsure on how to show all that in a tooltip
(your guess is a strange coincidence BTW)
This part especially is a WIP, with the formula introduced in a recent patch still in a testing/development phase
The current formula is quite complex, it's this function ("self" is the plot object)
Code:
function GetOutputPerYield(self)
    if self:IsWater() then
        return PlotOutputFactor[self:GetEraType()]
    else
        return self:GetSize() * self:GetActivityFactor() * PlotOutputFactor[self:GetEraType()]
    end
end
where:
- PlotOutputFactor is a table that contains different values per era
Code:
PlotOutputFactor     = {
    ["ERA_ANCIENT"]         = 0.50 ,
    ["ERA_CLASSICAL"]         = 0.65 ,
    ["ERA_MEDIEVAL"]         = 0.80 ,
    ["ERA_RENAISSANCE"]     = 1.00 ,
    ["ERA_INDUSTRIAL"]         = 2.00 ,
    ["ERA_MODERN"]             = 3.00 ,
    ["ERA_ATOMIC"]             = 4.00 ,
    ["ERA_INFORMATION"]     = 5.00 ,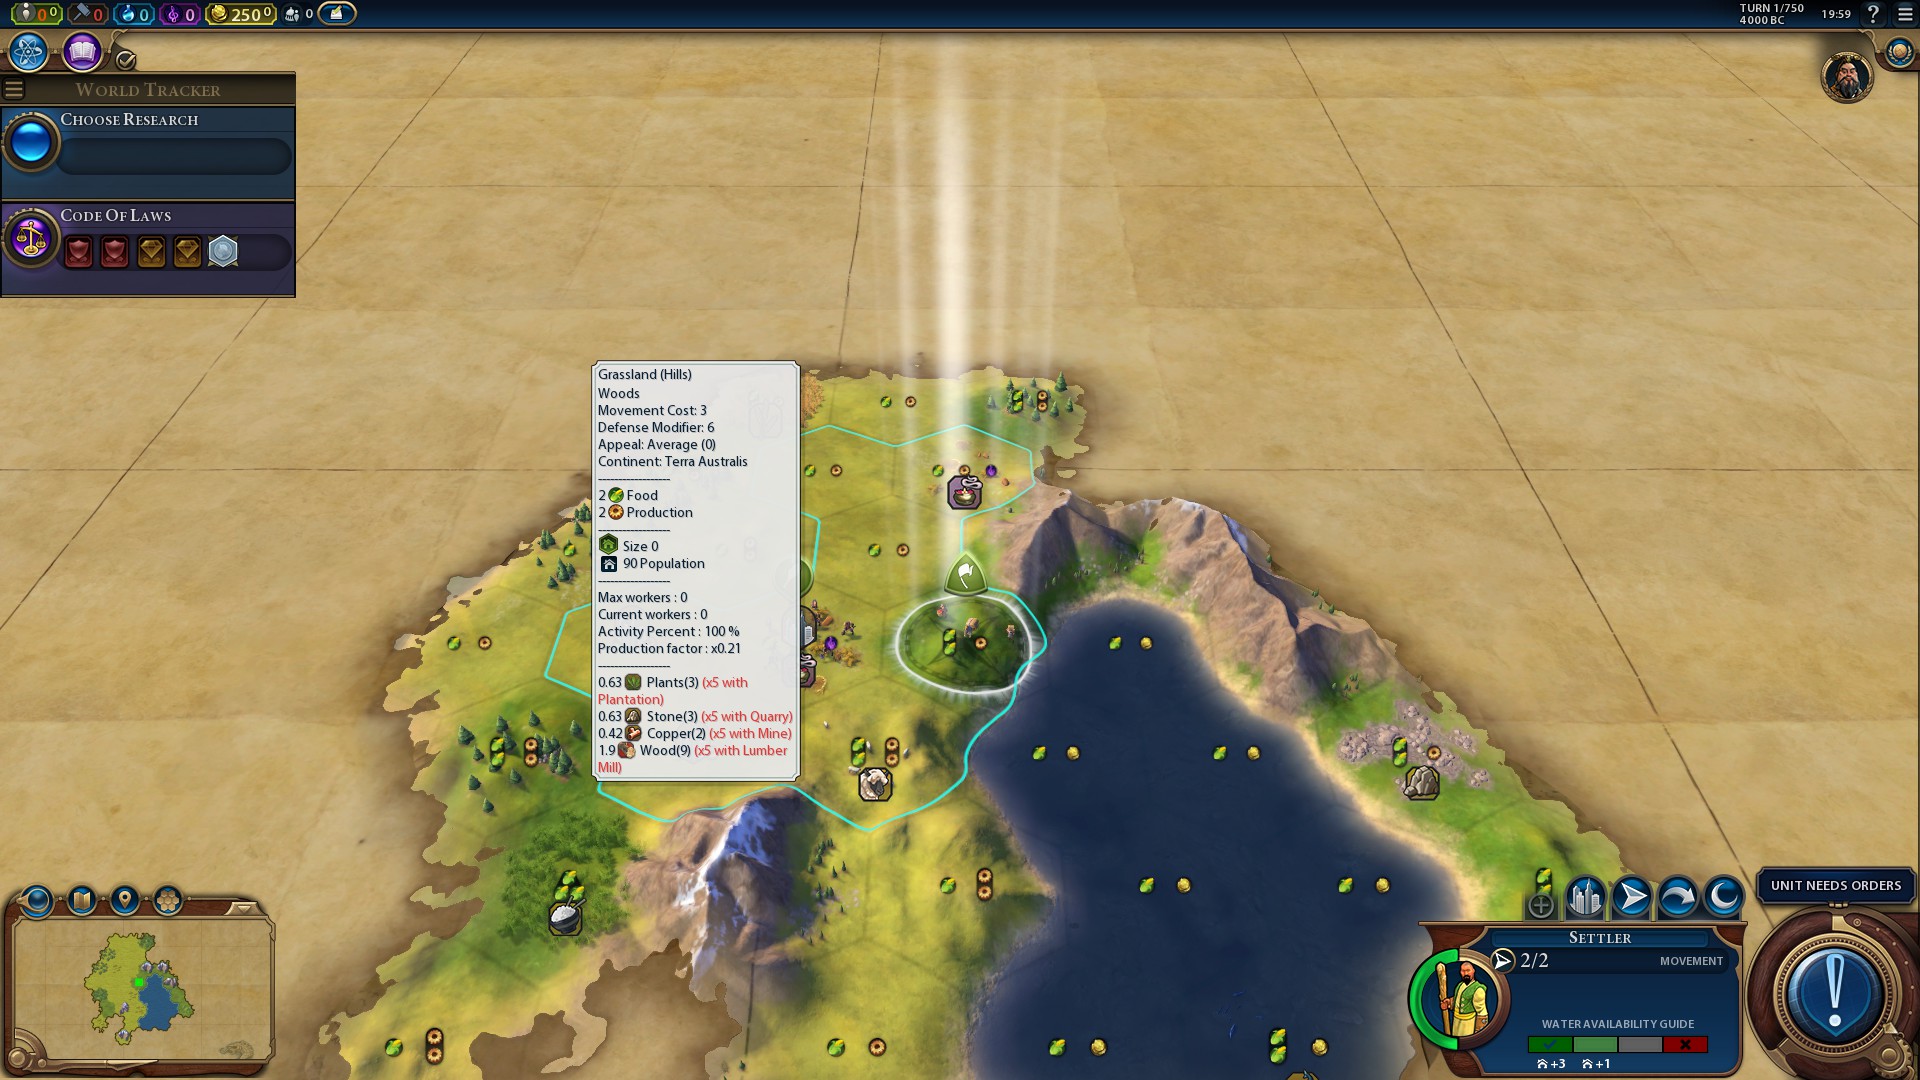
}- self:GetSize() return the size of the plot based on it's population but not rounded (the screen shows "size 3" which means between 2.50000... and 3.499999...) as by the formula below (where populationPerSizepower is 2.8 as in civ4/5 IIRC)
Code:
function GetSize(self)
    return math.pow(self:GetPopulation()/1000, 1/populationPerSizepower)
end- and self:GetActivityFactor() is the function below, where employmentFromResources and employed are real population values. Incidentally it's the ratio that directly gives the Activity Percent shown on your screenshot
Code:
function GetActivityFactor(self)
    local employmentFromResources     = self:GetMaxEmployment()
    local employed                    = self:GetEmployed()
    if employmentFromResources > employed  then
        return (self:GetEmploymentSize(employed) / self:GetEmploymentSize(employmentFromResources))
    else
        return 1
    end
end
self:GetEmploymentSize() is another function that return a size, as shown below, but using a variable pow and factor per era (where for population size we use a fixed pow = 2.8 and fixed factor = 1000)
Code:
function GetEmploymentSize(self, num)
    return GCO.Round(math.pow( num / self:GetRuralEmploymentFactor(), 1  / self:GetRuralEmploymentPow()))
end
Here self:GetRuralEmploymentFactor() and self:GetRuralEmploymentPow() returns the values from the table below, depending on the plot's owner era or the game's average era:
Code:
PlotEmploymentPow        = {
    ["ERA_ANCIENT"]         = 1.80 , -- 1.80 = Max City pop Pow - 1.00 : this way the summation of all worked plots can't be > to the total city population (using pow 2.80) <- but this is obsolete as we use urban population only to determine city size
    ["ERA_CLASSICAL"]         = 1.79 ,
    ["ERA_MEDIEVAL"]         = 1.77 ,
    ["ERA_RENAISSANCE"]     = 1.75 ,
    ["ERA_INDUSTRIAL"]         = 1.60 ,
    ["ERA_MODERN"]             = 1.55 ,
    ["ERA_ATOMIC"]             = 1.52 ,
    ["ERA_INFORMATION"]     = 1.50 ,
}

PlotEmploymentFactor     = {
    ["ERA_ANCIENT"]         = 1000 ,
    ["ERA_CLASSICAL"]         = 950 ,
    ["ERA_MEDIEVAL"]         = 900 ,
    ["ERA_RENAISSANCE"]     = 850 ,
    ["ERA_INDUSTRIAL"]         = 700 ,
    ["ERA_MODERN"]             = 600 ,
    ["ERA_ATOMIC"]             = 550 ,
    ["ERA_INFORMATION"]     = 500 ,
}
The same kind of formula is used in cities for employment size, maybe with a few difference, I need to check the code, but the table are as follow:
Code:
CityEmploymentPow     = {
    ["ERA_ANCIENT"]         = 2.00 , --1.00 ,
    ["ERA_CLASSICAL"]         = 2.05 , --1.10 ,
    ["ERA_MEDIEVAL"]         = 2.12 , --1.25 ,
    ["ERA_RENAISSANCE"]     = 2.25 , --1.50 ,
    ["ERA_INDUSTRIAL"]         = 2.65 , --2.20 ,
    ["ERA_MODERN"]             = 2.70 , --2.30 ,
    ["ERA_ATOMIC"]             = 2.75 , --2.50 ,
    ["ERA_INFORMATION"]     = 2.80 , -- 2.8 is max city population
}

CityEmploymentFactor     = {
    ["ERA_ANCIENT"]         = 500 ,
    ["ERA_CLASSICAL"]         = 550 ,
    ["ERA_MEDIEVAL"]         = 600 ,
    ["ERA_RENAISSANCE"]     = 650 ,
    ["ERA_INDUSTRIAL"]         = 800 ,
    ["ERA_MODERN"]             = 900 ,
    ["ERA_ATOMIC"]             = 950 ,
    ["ERA_INFORMATION"]     = 1000 ,
}
For an example, in your first screen (the second seems broken, it's not shown on my PC), you should have
Production Factor (OutputPerYield)
=
self:GetSize() * self:GetActivityFactor() * PlotOutputFactor[self:GetEraType()]
=
math.pow(29138/1000, 1/2.8) * (self:GetEmploymentSize(29138) / self:GetEmploymentSize(89254)) * PlotOutputFactor[""ERA_ANCIENT""]
=
math.pow(29138/1000, 1/2.8) * (Round(math.pow( 29138 / 1000, 1 / 1.80) / Round(math.pow( 89254/ 1000, 1 / 1/1.80)) * 0.5
= 3.33 * ( 7 / 12 ) * 0.5
= 0.97125
So I'm unsure on how to show all that in a tooltip
(your guess is a strange coincidence BTW)