The hottest year.

and how come it is an anomaly, in first place?

Anomaly comparing to what?

EDIT: BTW this is a corrected graph...

0817nasa.jpg


note the Y axis.

And although that shows a local temperature spike around 1934, there is still an obvious upward trend on that graph.
 
Are there other graphs that go into greater detail?

My cynical side says there's something that happened before 1880 the people that made the graphs didn't want us to see.
 
My non skeptical side says that it's probably because that's when reliable mesurments began.
 
Are there other graphs that go into greater detail?

My cynical side says there's something that happened before 1880 the people that made the graphs didn't want us to see.

Please be aware that Climatetology is a very recent science I seriously doubt there was the scientific know how for detailed data collection in 1880. Or the funding for it to be carried out in any meaningful way.
IRRC thats was preindustrialisation and steam power had just been discovered
 
NASA said that accusations from climate skeptics of a cover up are unfounded, according to CanWest News Service.

"This is not a hundredths of a degree issue. This isn't some kind of statistical quirk. It's very, very clear [that global warming is happening]," Gavin Schmidt, a climatologist at NASA's Goddard Institute for Space Studies, told CanWest News Service in a phone interview. "A lot of this is because people are making that confusion, and some people are deliberately making that confusion to make [the correction] seem like a bigger deal than it actually is."

The revision comes roughly a year after NASA announced delays in the next generation of satellites needed to monitor Earth's changing climate and environment.

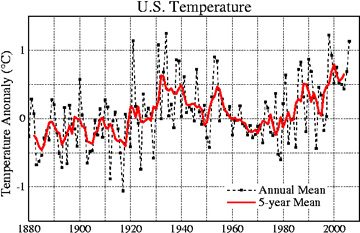
Mean global temperature data still show the 2005 is the warmest year on record. Further, the 5-year mean temperatures in the U.S. continue to show a warming trend.
For some reason this part of the article was missing from the OP. It seems to have created a little bit of confusion, so I thought I'd post it anyway.

You're welcome :)
 
I saw this article a week ago on some random web site, and was wondering how long it was gonna be before somebody was gonna post it. :)

My response? I CALLED IT. In one of the dozens of previous global warming threads, I raised the possibility that "maybe we're simply measuring wrong". And guess what--we did.

Don't get me wrong. This NASA incident has done nothing to change my opinion of global warming--I remain undecided on whether it's happening and whether it's really people who are causing it. But the NASA incident demonstrates that people CAN screw up very simple and obvious things, even things as simple and obvious as reading a thermometer.

You have GOT to take that into consideration, folks. Not naming any names, but a lot of you don't.


Edit: I like this part, by the way:
According to the new estimates, the hottest year since 1880 is 1934 instead of 1998, which is now second. 1921 is now third, followed by 2006, 1931, and 1999.

The fact that the hottest temperatures on record seem to hopscotch back and forth between the 21st century and the Roaring 20's indicates that today's (allegedly) warm weather might merely be a high point in a long-term cycle we haven't yet detected.
 
"A lot of this is because people are making that confusion, and some people are deliberately making that confusion to make [the correction] seem like a bigger deal than it actually is."
I liked this part, how it sais: "some people", not naming any names of course :D

This part is quite noteworthy as well.

The change has little effect on global temperature records and the average temperatures for 2002-2006 (at 0.66 ºC) is still warmer than 1930-1934 (0.63 ºC) in the United States. NASA said there is still evidence that temperatures are trending upward
Now lets disect the term Global Warming. It has two words, 1. "warming", which seems pretty straightforward, and more importantly: "Global".

So: "Snow in Costa Rico" or "The measurements of a small timeframe in one part of the world are off by 0.15C", are irrelevant on their own. Funny enough, you can measure global warming only by measuring the average global temperatures. I know it sounds counterintuitive for "some people" but there you have it :)
 
Well, allright, if you insist.
"A lot of this is because people are making that confusion, and some people are deliberately making that confusion to make [the correction] seem like a bigger deal than it actually is."
This is crap! Why would anyone want to deny the obvious!? This article makes claims about people which I am unwilling to accept. Those "some people" might have been around during the middle ages when "average" was considered a librul elitist egghead term, but we have progressed since then ... haven't we?
 
Please be aware that Climatetology is a very recent science I seriously doubt there was the scientific know how for detailed data collection in 1880. Or the funding for it to be carried out in any meaningful way.
IRRC thats was preindustrialisation and steam power had just been discovered
Which leads me to the next question... how can we then say with any certainty that increases in the temperature are man-made and not just the product of a regular climatological cycle?
 
Humans, factories, and other things that cause the "false" global warming existed in the 1930's too...

A lot of which were lying dormant during a massive worldwide depression.

I'm willing to bet money that in 50 years history textbooks will be talking about our generation and how they all thought the world was going to be ravaged by global warming. It'll end up having the same credibility of the pending ice age of the 70s, swarms of killer bees, SARS epidemic, and the various other things the media likes to use to instill fear to boost ratings. Sure doom and gloom sells, I'm just not buying.
 
I'm willing to bet money
Oh my, money.

I am afraid the stakes are a little higher. And I'm afraid this time most of what you are betting with does not belong to you. Some of it is mine :)

Note: I'm not talking about the end of the world or even the end of life, just so you know. ;)
 
Are there other graphs that go into greater detail?

My cynical side says there's something that happened before 1880 the people that made the graphs didn't want us to see.

Even worse, the world famous Mann's hockey stick graph was, IMHO, a fraud. The original graph, see below, has a hockey stick shape, showing temperatures being stable up to 1900 and a spike in the last century.

300px-Hockey_stick_chart_ipcc.jpg
Nature 392: 779-787
(notice that the graph ends in 1998, the warmest year since 1934)

McIntyre (again) and McKitrick pointed out errors in data analysis and several corrigenda have been published since then, including one by Mann where he says that "more widespread high-resolution data are needed before more confident conclusions can be reached and that the uncertainties were the point of the article."

300px-1000_Year_Temperature_Comparison.png


EDIT: I hit the submit button by mistake...

My main criticism is that the original Mann's graph doesn't fit with what he know about how the weather in the middle ages was by historical records (pics and writings) It doesn't show the Medieval warming period nor the little ice age and the article should have been published in a minor journal pointing out the failure of tree rings measurements as temperature proxies. In layman terms, tree ring widths are not accurate enough to reconstruct past temperatures. But, oh. this Mann guy seems to be a top dog at the IPCC and he must be friends with the editor of Nature.
 
Oh my, money.

I am afraid the stakes are a little higher. And I'm afraid this time most of what you are betting with does not belong to you. Some of it is mine :)

Note: I'm not talking about the end of the world or even the end of life, just so you know. ;)

Where you just as convinced that we were headed for an ice age in 70s? We had the same hype, same "scientific consesus", but in the end it turned out to be completely wrong.
 
Back
Top Bottom