OK, graphics time.
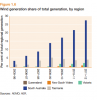
First up, wind share of total generation:
This shows the steady increase of total market share in South Australia's electricity market. Note this is actual generation supplied, not capacity.
The important thing is what it does as it ramps up, in terms of impacting the wholesale spot price:
See how the peak of SA wholesale prices occurs back in 2007-08 when wind was still less than 10%? That's because back then there were mostly coal plants and a limited import capacity, so on hot days the coal plants could bid whatever they want and still sell their electricity.
ALSO note how the costs of energy aren't actually rising in recent years? That's important when we talk about the cause of our constant rapid electricity bill rises over the last five years.
(The impact of the carbon price, BTW, will be seen in the 2012-13 figures when they're available, but will be complicated by the flooding at Yallourn, a brown coal plant which supplies 8% of electricity in the National Electricity Market. It'll be a step change, and set the new long term average at a higher point. My guess is it'll settle at around $50/MWH, around what it was in 2006-07, but with less carbon-intense electricity.)
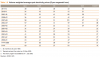
That's best shown by this graph:
Really high trading intervals. All that dark blue South Australian bidding hits its peak in 2007-08 to 2009-10, creating the really high spot prices you see above.
Then what happens? Two things. One is lower demand, both due to milder weather and solar PV takeup now that solar panels pay for themselves over their lifetime (solar PV shows up to the grid as reduced demand).
The other is that wind starts to kick in, and now that it's a quarter of generation, it starts to reduce the opportunities for really really high bidding. Winjd doesn't always correlate with high demand days, but there's enough days when it's both high demand and windy that the merit order effect comes into play, and the average wholesale prices come back down.
The flowthrough of these lower average spot prices hasn't yet fully carried over to retail prices. That's unfortunate, and partly a result of SA, like most states, having annual regulated price determinations instead of market rates. So when the wholesale price drops, South Australians on market tariffs will experience the reduction but there's no automatic mechanism to reduce the billing rates for customers on the regulated tariff, they have to wait for the regulator to make its next annual decree.
The lack of passthrough of lower wholesale prices is also, in large part, because
actual energy costs are only about 40% of a household bill. Network costs are most of the rest, and they're also rising rapidly due to rising peak demand driven predominantly by air conditioners. So even as the SA energy cost drops, they're still copping network cost rises like everyone else.
Incidentally, one government estimate says that installing a $1000 air conditioner imposes $7000 in network costs that must be spread across everyone paying bills. Our lack of time of use pricing means people who don't use air conditioning are directly subsidising those who do. Flat regulated tariffs are regressive.
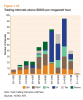
Here is the typical cost breakdown of a residential power bill in 2011:
You can see that SA with its major renewable penetration doesn't have notably different bill costs than other states. Its energy cost component is a higher proportion, which accounts for their higher bills and should drop over the next couple of years now that wholesale prices are at the national average (despite the supposedly super expensive wind). So there's no reason for Adelaide to continue to have more expensive electricity unless its network is more costly per person. Given the heat there, this might actually be the case, but I don't have enough knowledge there.
Side note, the other impact of this has been to reduce SA's status as a constant major net importer of electricity, though not completely, so far:
All graphs except the one I made are from the Australian Energy Regulator's (part of the ACCC)
State of the Energy Market report.

")