You are using an out of date browser. It may not display this or other websites correctly.
You should upgrade or use an alternative browser.
You should upgrade or use an alternative browser.
Gathered Statistics
- Thread starter Elta
- Start date

Elta
我不会把这种
Integral, that blog is very interesting 
SS-18 ICBM
Oscillator

Population density is a confounding variable, so don't be quick to draw conclusions.
Narz
keeping it real
Yeah, per square mile, that's kind of silly.
civ editor11
Ruler
It should be by percent of the eligible population(The amount of population old enough to have a college degree)
Mise
isle of lucy
It's not silly at all -- it just depends on what conclusion you want to draw from it, or what decision you want to make based off it.
For example, if I'm a high-tech company looking to build a new office, I want to put it somewhere within easy reach of a lot of highly qualified people. Judging from that chart, NYC or SF would be ideal, since there is such a high concentration of graduates there.
Of course, a better chart would state the number of unemployed graduates, or recent graduates, in which case I'd imagine "university towns" would score much higher.
But the point is, the chart is useful, it just depends on what you're looking for.
civ editor11
Ruler
Yeah that makes sense thanks for explaining it
Integral
Can't you hear it?
In the true spirit of this thread, here's something I've been working on for a little bit.
Recall that there was some deflation in 2008, particularly from June to December. I've been curious as to how far of a hole we've dug in the price level over the past couple of years.
Exhibit 1: the chart.
Blue line is the US Consumer Price Index. Dates start at 1=2007Jan, 2=2007Feb, ..., 40=2010Apr. Thus 12 is December 2007, 24 is December 2008, 36 is December 2009, and 40 is April 2010.
Red line is a counterfactual that uses the 2007 data to forecast the 2008, 2009, and 2010 data. The counterfactual was derived using OLS regression, exponential model.
Intuitively, the red line is where prices 'should be' and the blue line is where they actually are.

x-axis: time in months,1=2007Jan
y-axis: level of Consumer Price Index, actual and counterfactual
Exhibit 2: deflation and the 'price gap'
From the chart (and accompanying data), we find that consumer prices fell 7.6% at an annual rate in the second half of 2008.
Also from the chart, the difference between where the price level is and where it should be is about -5.7%. That means that prices are almost 6% lower than they would have been had the financial crisis not occurred.
I'll do nominal expenditures later, but those are more tricky because they are released quarterly rather than monthly.
Recall that there was some deflation in 2008, particularly from June to December. I've been curious as to how far of a hole we've dug in the price level over the past couple of years.
Exhibit 1: the chart.
Blue line is the US Consumer Price Index. Dates start at 1=2007Jan, 2=2007Feb, ..., 40=2010Apr. Thus 12 is December 2007, 24 is December 2008, 36 is December 2009, and 40 is April 2010.
Red line is a counterfactual that uses the 2007 data to forecast the 2008, 2009, and 2010 data. The counterfactual was derived using OLS regression, exponential model.
Intuitively, the red line is where prices 'should be' and the blue line is where they actually are.
x-axis: time in months,1=2007Jan
y-axis: level of Consumer Price Index, actual and counterfactual
Exhibit 2: deflation and the 'price gap'
From the chart (and accompanying data), we find that consumer prices fell 7.6% at an annual rate in the second half of 2008.
Also from the chart, the difference between where the price level is and where it should be is about -5.7%. That means that prices are almost 6% lower than they would have been had the financial crisis not occurred.
I'll do nominal expenditures later, but those are more tricky because they are released quarterly rather than monthly.
SS-18 ICBM
Oscillator
So does that mean interest rates need to be increased now?
Integral
Can't you hear it?
If anything, it means that interest rates need to be as low as possible - negative, in fact. Getting prices back on trend would do quite a bit of good in ending the post-recession 'hangover'.
Simplifying a bit, we should raise interest rates when the actual CPI is above trend and reduce interest rates when the actual CPI is below trend.
Simplifying a bit, we should raise interest rates when the actual CPI is above trend and reduce interest rates when the actual CPI is below trend.
civ editor11
Ruler

SS-18 ICBM
Oscillator
If anything, it means that interest rates need to be as low as possible - negative, in fact. Getting prices back on trend would do quite a bit of good in ending the post-recession 'hangover'.
Simplifying a bit, we should raise interest rates when the actual CPI is above trend and reduce interest rates when the actual CPI is below trend.
Whoops, kinda mixed it up there. Forgot raising interest rates is for fighting inflation.

Narz
keeping it real
Fair enough.It's not silly at all -- it just depends on what conclusion you want to draw from it, or what decision you want to make based off it.
For example, if I'm a high-tech company looking to build a new office, I want to put it somewhere within easy reach of a lot of highly qualified people. Judging from that chart, NYC or SF would be ideal, since there is such a high concentration of graduates there.
Of course, a better chart would state the number of unemployed graduates, or recent graduates, in which case I'd imagine "university towns" would score much higher.
But the point is, the chart is useful, it just depends on what you're looking for.
Mise
isle of lucy
Rate hawks might look at that graph, draw a trendline from t=24 onwards, then track it back to t=0, noting that it fits almost perfectlyIf anything, it means that interest rates need to be as low as possible - negative, in fact. Getting prices back on trend would do quite a bit of good in ending the post-recession 'hangover'.
Simplifying a bit, we should raise interest rates when the actual CPI is above trend and reduce interest rates when the actual CPI is below trend.
") They'd call what happened at the end of 2008 the correction from short-term high inflation; from 2009 onwards we've reverted to a "long term trend" of low inflation.
They'd call what happened at the end of 2008 the correction from short-term high inflation; from 2009 onwards we've reverted to a "long term trend" of low inflation.By eye, it looks like t=24 to present gives about 2.0-2.5% CPI?
Integral
Can't you hear it?
Mise:
Yep, if you care about rates instead of levels, inflation performance since December 2008 (after the bottoming out of the deflationary spiral) is approximately on target.
I've updated the previous graph with (1) the May 2010 data point and (2) by going back to 2004.
CPI, trend and actual, 2004Jan to 2010May

CPI: the consumer price index
cpifac: the counterfactual CPI, derived from the 2004-2007 trend
Time is in months. 12=2004Dec, 24=2005Dec, 36=2006Dec, 48=2007Dec, 60=2008Dec, 72=2009Dec
I wanted to get a longer trend line. The trend is fitted to 2004-2007, inclusive; average yearly inflation was 2.6% over that period. Everything here is done with standard OLS techniques.
Inflation post-Deflation, 2009-2010
This graph zooms in on 2007-2010.

CPI: the consumer price index
cpifac: the trend carried over from last graph
cpifac2: the trend take solely from 2009-2010
Remember, 37-48 is 2007, 49-60 is 2008, 61-72 is 2009, and 73+ is 2010. I wish I could get the months in as markers, but I'm too lazy to get Stata to do that for me. Perhaps later.
The average inflation rate since 2008Dec is 1.8%. Not too bad if we ignore the level gap. From a purely rate perspective, monetary policy mostly has recovered from the deflationary disaster of 2008; from a level perspective, we still have quite a bit of ground to make up.
I'll get this post up, but will edit it with nominal expenditures later.
Yep, if you care about rates instead of levels, inflation performance since December 2008 (after the bottoming out of the deflationary spiral) is approximately on target.
I've updated the previous graph with (1) the May 2010 data point and (2) by going back to 2004.
CPI, trend and actual, 2004Jan to 2010May
CPI: the consumer price index
cpifac: the counterfactual CPI, derived from the 2004-2007 trend
Time is in months. 12=2004Dec, 24=2005Dec, 36=2006Dec, 48=2007Dec, 60=2008Dec, 72=2009Dec
I wanted to get a longer trend line. The trend is fitted to 2004-2007, inclusive; average yearly inflation was 2.6% over that period. Everything here is done with standard OLS techniques.
Inflation post-Deflation, 2009-2010
This graph zooms in on 2007-2010.
CPI: the consumer price index
cpifac: the trend carried over from last graph
cpifac2: the trend take solely from 2009-2010
Remember, 37-48 is 2007, 49-60 is 2008, 61-72 is 2009, and 73+ is 2010. I wish I could get the months in as markers, but I'm too lazy to get Stata to do that for me. Perhaps later.
The average inflation rate since 2008Dec is 1.8%. Not too bad if we ignore the level gap. From a purely rate perspective, monetary policy mostly has recovered from the deflationary disaster of 2008; from a level perspective, we still have quite a bit of ground to make up.
I'll get this post up, but will edit it with nominal expenditures later.
ParadigmShifter
Random Nonsense Generator
That's a sexy graph, I wan't to be the differential operator so I can be tangent to it's curves.
Integral
Can't you hear it?
Updated with nominal final expenditures.
Blue is actual; red counterfactual. We are currently some 11.5% below trend; this is a combination of a 6% decline in real quantity sold (relative to trend) and 5% decline in prices (relative to trend).

The reason I use nominal instead of real quantities is that the monetary authority can, if it so chooses, hit any nominal target it wishes to (say, prices or nominal expenditures). It cannot successfully target real quantities, such as real GDP.
Blue is actual; red counterfactual. We are currently some 11.5% below trend; this is a combination of a 6% decline in real quantity sold (relative to trend) and 5% decline in prices (relative to trend).
The reason I use nominal instead of real quantities is that the monetary authority can, if it so chooses, hit any nominal target it wishes to (say, prices or nominal expenditures). It cannot successfully target real quantities, such as real GDP.
 Ohhh, it's a bar chart..."
Integral
Can't you hear it?
Although this one is not of my own creation, it's in the vein of the charts recently posted so I figured it could get its own post.

In case anyone's wondering about the recent deluge of policy-related charts, I'm mulling over starting a srs business thread on OT in the next few days to talk about the appropriateness of further stimulatory policy. The thread on environmental policy went well enough, considering.
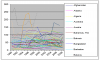
edit: and here's unemployment across the G-7. Notice the outlier; this is why certain countries will be more worried about stimulus, and others about budgets, in the coming meetings. Image is spoiled for being largish.

In case anyone's wondering about the recent deluge of policy-related charts, I'm mulling over starting a srs business thread on OT in the next few days to talk about the appropriateness of further stimulatory policy. The thread on environmental policy went well enough, considering.
edit: and here's unemployment across the G-7. Notice the outlier; this is why certain countries will be more worried about stimulus, and others about budgets, in the coming meetings. Image is spoiled for being largish.
Spoiler :
Similar threads
- Replies
- 38
- Views
- 3K
- Replies
- 3
- Views
- 1K