Gothmog said:
Urederra, though you obviously never read anything I post I'll keep trying for a bit longer.
I read them, but my time is not unlimited, you know, so I answer when I have time and feel like to. I skim over the other posters name-calling posts, thought, I am not interested in name-calling.
Gothmog said:
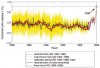
Here is a plot from a reference I have tried to get you to look at three times now, the recent (Feb 2005) work by A. Moberg as published in Nature:
http://www.civfanatics.net/uploads10/recon.gif
You will note both the medieval warm period (which indeed was a local phenomena according to most reputable work in the area, no one denies it existed) and the little ice age. The little ice age is certainly more pronounced than in the Mann work but the medieval warm period is within 0.2 degrees and well within the error bars even at one sigma. The reasons for that are discussed in the paper if you are interested. Basically the new work emphasized inland temperature records and also used a very new wavelet analysis for temperature reconstruction that allows temperature records of different sampling and averaging frequencies to be combined more readily.
Yeah, now I can see the medieval warm period as well as the little ice age.
gothmog said:
You will note the same 0.5 degree warming, and the same hockey stick pattern.
Sorry, but I cannot agree with that. Are you trying to convince me that this graph
and this graph
(Edit: I look only from the year 1000, since mann´s graph stats on the year 1000)
have the same hockey stick pattern? Before and after being broken, maybe. I look at the Moberg graph (Edit: As I said, from the year 1000) and what I see is a sinusoidal curve, rather than a hockey stick. Something similar than this:
although less pronounced. Now I can see the Medieval Warm period in the Moberg graph, also I can see the little ice age, as you said, (coincident with the Maunder minimun, BTW, which marks a period of known low solar activity). The problem is that Moberg graph hasnt got the hockey stick pattern.
And how does the CO2 levels fit with the Moberg graph?. Very badly indeed. It doesnt fit in the last 100 years (remember the 1950 1970 cold period) and it doesnt fit in the previous 900 years where the CO2 levels havent changed but the temperatures have fluctuated.
Of course CO2 levels fitted with Manns graph, but in Manns graph you dont see the medieval warm period and the little ice age is almost inexistent. Manns graph does not fit with the historical facts we know about the harsh winters during the 16th and 17th centuries. And there werent local phenomena, although there were more documented on Europe for obvious reasons. In Ethiopia and Mauritania, permanent snow was reported on mountain peaks at levels where it does not occur today. Timbuktu was flooded at least 13 times by the Niger River; there are no records of similar flooding before or since. In China, warm weather crops, such as oranges, were abandoned in Jiangxi Province, where they had been grown for centuries. In North America, the early European settlers also reported exceptionally severe winters. For example, in 1607-8 ice persisted on Lake Superior until June. They weren't phenomena that only happened in Europe and Greenland.
The problem is that the IPCC took Manns graph to tell us that there is a strong relation between CO2 levels and global mean temperature, when this is not true. And why is Manns graph so faulty? Why did he only took a single tree to reconstruct the temperatures of the first 2 centuries in his graph? Maybe because other trees he studied gave him results that didnt fit Ruddiman theories (they work in the same group, I remind you) Or maybe he was lousy and though that one single tree should be enough. He was also so lousy with the maths that other two non weather scientists, McIntyre and McKtrick proved him wrong. One way or another, this guy cannot be a reviewer of the journal Science. A journal like science receives lots of papers but only publishes a few, the ones that pass through many filters. Mann is one of the filters and the other weather scientists knows that, so they try to write their papers according to Manns likings, so they can pass Manns filter. In science if you dont publish you perish, so is better for those weather scientists to agree with Sciences weather reviewer. It is sad that Science had such a lousy/cheating man as part of its staff. No wonder Moberg et al. have published in Nature. They know that they never could have passed Manns filter. Hopefully, Manns days as a top dog scientist are counted.
http://news.bbc.co.uk/1/hi/sci/tech/4693855.stm
gothmog said:
Mars is not relevant, again we don't have data anywhere close to what we do for earth. The ice cap changes are basicaly anecdotal.
snip
I also agree that the sun is important and have posted many more references that show the true magnitude of the known connections.
Mars is relevant since it is less complex than Earth and could help us to understand a bit more how the climate works. In this case we show that the annual average size of the mars ice caps are shrinking, and that happened just when the sun is being very active, maybe the true magnitude of the known connections has been underestimated or there are unknown connections. Mars and Earth weather changes follow similar patterns. Both of them have been suffering an increase of temperatures and that coincides with a period of increased sun activity.
Gothmog said:
For there to be a link to magnetic activity it would have to involve cosmic rays, this is an area of research I am actively involved in actually. Problem is there is no known mechanism of action for this link, though we are searching for one. That's one of the basic tenants of science, there must be a mechanism of action.
Good luck with your research.

I hope you find the mechanism of action. You can kick Mann's ass out of Science if you succeed.

Dont try to publish it in Science, try Nature instead
")
I will try to answer other issues in following posts, but my time is not unlimited, My spare time is limited, and although I like to read CFC and reply the posts, these weather ones take me a lot of time.