Don´t worry too much about the American store name, ´cos I live in Argentina, and all names are in Spanish. I think what you mean is "papel milimetrado", according to what wikipedia
says graph paper is.
Papel milimetrado has little squares of 1 mm (millimetres) , then of 5 mm and 10 mm. I´m not sure there is 8 1/2 X 11" size around in this country, but I could try or, if not, paste it onto a page that size. How should I rotate the map? It was made as an illustration cover for a brochure for the Ermitage exhibition in Amsterdam about Persia. I could send you an image, though, by next week.
I think you found the same kind of paper, it's just metric instead of inches. The size of the paper doesn't matter, as long as it will fit in your printer. The size of the squares doesn't matter much either, as long as you realize one square on the paper = one tile on the map in the editor, regardless of how big the squares are. I just measured the paper I use & the squares are 2 mm X 2 mm. I use small squares so my map prints on a minimum of pages.
These are the steps:
1) Find the image you want to make into a map. Either it is already a computer file (like one of the maps to be found on Wikipedia, or the
National Geographic MapMachine), or you will need to scan it into a computer file that you can edit in a graphics program and then print. At this point the size of the image is not too important, as long as it has enough detail to satisfy you.
2) Decide the size you want the map to be in Civ (like 100 tiles across).
Measure how far across one square on your paper is on the
diagonal (\ not _). It's ok to round off to the nearest whole number (say 2 mm, not 2.05 mm for example)
3) Multiply that by how many tiles across you want your map to be. (Just as an example, if my paper has squares 2 mm on the diagonal and I want my map to end up 100 tiles across, then 2 x 100 = 200 mm.)
4) In your graphics program scale the map image <=> to be the same size as the number you just came up with. Be sure to keep the vertical dimension in proportion for now.
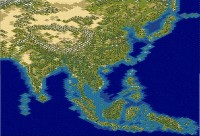
5) At this point you have a choice to make. If you look at a map in the game you will see that the tiles look like diamonds <> while on your paper you have squares [ ]. Also, the tiles in game are not just rotated squares, they are flatter from top to bottom than from side to side. I like the actual game map to match the original image, like this:
My Map
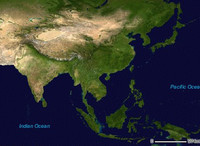
Satellite Image
Other people feel it is more correct for the
minimap to match, for reasons to do the mathematics of map projection; in this case the map in game would
look squeezed flat, but the proportions will be mathematically correct in terms of how far across the map the units move per turn. It is mostly a matter of taste, since we are not trying to make maps that people will navigate by in the real world.
A) If you are like me, at this point scale your image vertically 200% but be sure to keep horizontal 100%. The image will become twice as tall, but not change width.
B) If you want to keep the minimap as the one that "looks" correct, as some other people do, then skip this step.
6) Now rotate your image 45° in the graphics program. Which direction doesn't matter. The rotation will mean that one of the corners of the squares will point to the top of your image when you print. This orients the map to match the tile pattern in the editor.
7) Print.
Your map will probably print out across several sheets. You may wish to cut and paste them into one large map. I find it easier to work at the computer with the individual sheets; I make a master page from thumbnails, and print it on one sheet of plain paper, that looks like this:
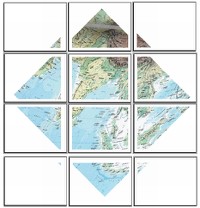
then I number each of the sheets and label the master page to match, so I always know where I'm at, relative to the whole map.
Now you've got on paper something that matches square for square what you want in the editor. As you create the map in the editor,
you can decide if islands need to be adjusted, where the edge of deserts should be, etc. Also, there is no need to correct a computer program's interpretation of a squashed down to 100 pixel by 100 pixel image, that will distort coast lines, exaggerate or shrink the size of lakes, shift mountain ranges, etc.
More effort to set up, but so much easier in the editor. When I made the Rise of Asia map, I just did the coast lines first, and filled in the land, all with plains terrain. That was just to see that the basic shape of my map was what I wanted. Then I went back and changed terrain as I needed.
Hope this explanation helps.
PS: I forgot to mention that depending on how dark the lines on your paper are you may find it useful to "fade" or "lighten" the image before printing, so the lines show through clearly.
PPS: I just noticed the links at the bottom of the wikipedia page to free programs to print graph paper. So you could print first the grid onto a plain page, and then run the paper through again to print your map. Or else find a way to superimpose the grid in your graphics program and then print once.


