Report and infraction statistics 2011

Interesting read and statistics.

Okay, that's an exaggeration :blush:.


Oh, some more fodder (I think I have too much time...): I noted by hand ever issued ban. So that's definitely not totally accurate.
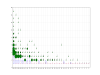
So...2011:
- 91 people received at least one ban
- 4 of these bans have been requested
- In total 167 temporary bans
- and 11 permabans for regular users were issued
- 46 people received only single bans
- 30 people two or more bans

The highest amount of temporary bans were 10 bans for a single user, 8 for another and 7 bans for 3 other people.

The numbers here don't add up. 46 people received one ban, 30 two or more, so that's 76 people. But you also said 91 people received at least one ban. :confused:

I didn't know CFC did actually grant requested bans at times. Good to know for future reference, although I don't expect to take advantage of that option at any point.

Other bans:
- 35 double logins (at least 8 resolving to a single person) have been kicked
- 61 troll DLs resolving to another person have been permabanned
- as well as 13 trolls of unknown source
- 6 accounts related to a piracy site have been permabanned
- Fastest temporary ban happened for a user, who received 8 points within 1 hour
- 4 people had to be permabanned after exzessive rants due to single infractions or temporary bans

Are those last 4 included in the first 11?

I like ilduce's question, too.
 
Interesting read and statistics.


The numbers here don't add up. 46 people received one ban, 30 two or more, so that's 76 people. But you also said 91 people received at least one ban. :confused:

Add the 4 requested bans and the 11 permabans and you should get 91.
 
How long did the slowest tempban take?

That depends on where you begin to count. Does it begin with the first infraction, the first ban, or the first permanent points? -> :dunno:.

Nice job J! :goodjob:

Just out of interest, where did the civ4 stories and tales subforum come in terms of post infracted/reported there?

Also, is it possible to see where the infractions were handed out?

Col S&T: 3 reports
Civ3 S&T: 23 reports
Civ5 S&T: 36 reports
Civ4 S&T: 47 reports

Can't say with the current data anything about the area of the infraction. Would have to download all the 4000+ infractions to see that, and I don't want to do that to the server.

Is there data for # of posts per infraction?

What I mean was, which forums were the worst at receiving fractions without the data being skewed with the volume of posts?

Like above, can't say that.

:think: mmhh...I'll maybe see when there's the lowest server load to start a download.

The numbers here don't add up. 46 people received one ban, 30 two or more, so that's 76 people. But you also said 91 people received at least one ban. :confused:

Oops :blush:, you're right.
I had not really organized that post before, so it's a bit messy.
First, 47 single bans, so there are 77.
+ 6 pirates (83)
+ 4 requests (87)
+ 4 "rage quits" (91)

...er...I maybe should rewrite that part :blush:.

Are those last 4 included in the first 11?

Yes they are :yup:.


What was the largest percentage of a moderator's infractions on a specific user?

Do you mean if there were e.g. users who received only infractions from a single mod?
If yes, then I can post that later.
 
Do you mean if there were e.g. users who received only infractions from a single mod?
If yes, then I can post that later.

That'd be interesting too.

But what I meant was something like Mod A and Mod B had both given out 20 infractions, but Mod A had given 10 of those infractions to a single user, and the other 10 were to 10 other users, while Mod B gave 4 infractions each to 5 different users.
 
phew...mmhh....yes, possible.
But you have to consider that one mod was responsible for more than 600 infractions, and that the three mods with the most infractions have together more than 1000.
I could display the stuff as box plots per mod (wikipedia: box plot), but since this display type is rather...er....technical, and not that vividly for a normal person (...well...better than a table), I'm not sure if it will satisfy you.
Else I can't think of a better display method.
 
Basically, the majority of infraction imposed (excluding of those on adbots) came from the three moderators most active in the Off Topic. It is where more than who, followed by who has the most stomach and energy for a tedious duty.
 
That depends on where you begin to count. Does it begin with the first infraction, the first ban, or the first permanent points? -> :dunno:.

I meant the slowest tempban from the first infraction to the start of the ban itself, which is how you measured the fastest tempban.
 
When were "permanent points" introduced? Do they essentially put whoever on a shorter leash?
 
I meant the slowest tempban from the first infraction to the start of the ban itself, which is how you measured the fastest tempban.

:dunno: no data about that.
But since infractions expire after at max. 30 days, it can't be slower than that.

When were "permanent points" introduced? Do they essentially put whoever on a shorter leash?

The permanent points were introduced at August, 21st (like also mentioned in the big graphs in OP ;)).
If you think about the statistics here, I don't think you can say anything in these regards, because if there was an effect, then it was a long term effect.
If you're more thinking about single users here...well...will not comment :p ;).
 
Interesting, thanks for putting it together.
Out of curiosity, did adbots focus their activities on any one area?

And of course I had to laugh at this:
OP said:
The vast majority game from the off-topic forum, with 3718 reports (51%),
 
Out of curiosity, did adbots focus their activities on any one area?

Can't again say anything about that with the current data :/ (and even if we had more: Not all bot posts get reported).
From my feeling...either the bots focus on high traffic areas (Civ5 and OT), or on the really low traffic areas (we regularly have some in CivRev).
And some are just stupid (one script, which reincarnated as several bots, only posted in Civ3 S&T).

Are you saying NOBODY got an 8-point infraction all year?;)

Oh, probably some people got one, but these are then not regular infractions, but more special one, and I did not want to talk about that, but rather about some more exceptional cases within the normal infractions.
 
Sorry for the delay :blush:.

But what I meant was something like Mod A and Mod B had both given out 20 infractions, but Mod A had given 10 of those infractions to a single user, and the other 10 were to 10 other users, while Mod B gave 4 infractions each to 5 different users.

Attention, not really small:
Spoiler :
attachment.php


As explanation: Every box plot is one mod. Each mod is "identified" with the number of infractions he/she handed out (there's a slight inaccuracy to the numbers of max. -1 to the numbers in the OP; no idea where that's coming from; does not include bots).
The boxes show in which area of # of infractions 50% of the mods infractions were...er...so...the mod to the left with 602 infractions had 50% interactions with users who received 1 - 3 infractions, whereas the following mods had to 50% only 1-2 infractions per user. The outlying arms represent 75%. The red bar is the median, which is nearly everywhere at 1, the red cross is the average, which is only in 3 cases higher than 2 infractions/user.
All the green circles identify users, which have received more infractions than 75% of all users from that mod (besides some of the left, which are below or direct at 75%; that's due to a bug in my script, sorry). The numbers at the plots show how many users, the size of the circles scales with that.

...okay...information overkill, I guess :D.
One example, there's the mod with 11 infractions. The box and the arms are on the same size like the median. Means 50% of all users as well as 75% of all users received only a single infraction from that mod (and the median is in the middle of all infractions, which is then also 1). There's only 1 user with more than one infraction, with 3. The mod has in total 11 infractions, 3 to that single user, and obviously the rest of 8 for single other users. Makes 11 infractions for 9 users, which brings the average a bit higher than 1.
Or the mods to the right, the one with 4 infractions (ignore the 1s about the points): 50%, 75% as well as the median is at 1, the average is 1, no infractions outside of the 75% -> 4 users, everyone a single infraction.

What else can we see: More infractions -> more interactions with single users. Well, you'd expect this just by change, wouldn't you?
We can also see, that nobody in the group of top offenders with 20+ infractions received infractions by a single mod, because the max. infractions of a mod per user is at 15.
Other notable points: The user who received 6 infractions from the mod with 15 infractions in total (so the maximum point in the right half of the diagram) was a troll, who was permabanned later, so that's an exceptional case (and it's clearly visible that it is exceptional).

Else I'd say the distribution is relatively like expected, no really big outliers or peaks anywhere.


Not sure when I'll have the chance to look at the other data.
To calculate such things like in which area the most infractions were handed out, the number of reports within these infractions, etc. would require to download all 5000 infractions, + the infracted reports. With a waiting time of 3 seconds between every download and an estimated download time of 2 seconds, this makes 50 000 seconds, or nearly 14 hours...that's a bit much.
 

Attachments

  • boxplot_mods_numbers.png
    boxplot_mods_numbers.png
    111.7 KB · Views: 236
Very interesting, thanks!

If only it had usernames... :p


Moderator Action: 1 post after this has been deleted.
Please remember people, no usernames here.
 
Thanks J.

That said in all sincerity, there is nothing intuitive about that chart and I still don't really understand it. Let me pick a random mod ;) say one of the guys who handed out 57 infractions, the one on the right.

He gave 57 infractions
7 people were infracted twice
1 person 3 times
1 person 5 times
15 multiple infractions and 42 singles

Is this right?
Why green ovals?

Is this correct:

The maximum number of different individuals who received 10 or more infractions from a single mod (one of three possibilities) is 11 and could be less if some of those points represent the same person. Those 11 people (assuming they are all different) received 132 infractions.
 
Yes, everything right, besides.

15 multiple infractions and 42 singles

7 * 2 infractions + 1 * 3 infractions + 1 * 5 infractions = 22 multiple, leaving 35 singles.

That said in all sincerity, there is nothing intuitive about that chart and I still don't really understand it.

:blush:
I'll maybe try if a simpler plot with just dots is somehow managable.

Why green ovals?

To show where the majority of the infractions in the outliers is.
So with a quick look on the graph you can see, that there are less people who received many infractions from a single mod, but more people who received less.
(just easier for the first look than the numbers)
 
Back
Top Bottom