Hi all!
Full disclosure, I am not a software engineer. I had to dig up my college Intro the CS course knowledge to make this, so I'm sure there are many, many ways it could be optimized. But! I've always been fascinated by the map, and by trying to place the best cities. I finally did something about it and wrote a program that produces a heatmap of food production and uses that to calculate maximum city sizes. Here are some assumptions and then the result!
- All food-boosting technologies are unlocked (Chemistry, Genetics)
- No food-boosting wonders, buildings, civics, unique powers, or unique buildings are present (Tsukiji Fish Market, Delta Works, Apothecary, Incan mountains, supermarket, etc.)
- No food-providing specialists
- All farmland is irrigated, despite the fact that there are a few plains on the map that cannot be irrigated (what comes to mind are islands and the flatlands to the east of Lake Baikal, but I’m sure there are others)
- All cities work their entire BFC
- All food resources are improved with their correct improvement, and all other tiles are improved with farms or windmills (even when non-optimal, say on a coal hill)
- The map allows you to place cities where RFC may not let you - tundra and desert without water. I left that in, as these cities aren't very well supported anyways.
- I used the 1700 AD map, so there are some late resources missing (Rice in Italy, flood plains and rice in California, most things in Australia)
- Currently, cities don’t get bonuses for being founded on resources or flood plains. This is an error I need to fix, but I’m… very tired. I’ll update this document when I do")
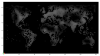
The brighter the color is, the more population the city can support
Twenty possible city locations had potential populations of 50 or over. These are:
(92, 38) 102 food, Ayodha 1W of Varanasi on the gems
(93, 38) 107 food, Varanasi on the hill
(94, 39) 100 food, Pataliputra on the dye
(105, 42) 102 food, Wuhan on the silk
(104, 43) 100 food, Kaifeng on the deer
(21, 47) 100 food, Kansas City 1S of the horse
(22, 47) 102 food, Kansas a city 1SE of the horse
(21, 48) 101 food, Omaha on the horse
(22, 48) 100 food, Omaha 1E of the horse
(54, 49) 103 food, Tours on the uranium
(55, 49) 104 food, Orleans 1S of standard Paris
(55, 50) 102 food, Paris (standard)
(57, 51) 101 food, Aix-la-Chapelle
(58, 52) 101 food, Cologne on the cow
(59, 52) 107 food, Munster 1S of the horse
(59, 53) 100 food, Goslar on the horse
(66, 53) 102 food, Brest-Litowsk on the horse
(67, 54) 100 food, Wilno 1E of the wheat
(67, 55) 102 food, Polock 1NE of the wheat
(68, 55) 101 food, Novgorod 1NW of the pig

(If someone could graciously help me embed an image... I used "[#IMG]" (no #) but it doesn't appear to be working.)
Full disclosure, I am not a software engineer. I had to dig up my college Intro the CS course knowledge to make this, so I'm sure there are many, many ways it could be optimized. But! I've always been fascinated by the map, and by trying to place the best cities. I finally did something about it and wrote a program that produces a heatmap of food production and uses that to calculate maximum city sizes. Here are some assumptions and then the result!
Spoiler Assumptions :
- All food-boosting technologies are unlocked (Chemistry, Genetics)
- No food-boosting wonders, buildings, civics, unique powers, or unique buildings are present (Tsukiji Fish Market, Delta Works, Apothecary, Incan mountains, supermarket, etc.)
- No food-providing specialists
- All farmland is irrigated, despite the fact that there are a few plains on the map that cannot be irrigated (what comes to mind are islands and the flatlands to the east of Lake Baikal, but I’m sure there are others)
- All cities work their entire BFC
- All food resources are improved with their correct improvement, and all other tiles are improved with farms or windmills (even when non-optimal, say on a coal hill)
Spoiler Odds and Ends :
- The map allows you to place cities where RFC may not let you - tundra and desert without water. I left that in, as these cities aren't very well supported anyways.
- I used the 1700 AD map, so there are some late resources missing (Rice in Italy, flood plains and rice in California, most things in Australia)
- Currently, cities don’t get bonuses for being founded on resources or flood plains. This is an error I need to fix, but I’m… very tired. I’ll update this document when I do
Spoiler Results! :
The brighter the color is, the more population the city can support
Twenty possible city locations had potential populations of 50 or over. These are:
(92, 38) 102 food, Ayodha 1W of Varanasi on the gems
(93, 38) 107 food, Varanasi on the hill
(94, 39) 100 food, Pataliputra on the dye
(105, 42) 102 food, Wuhan on the silk
(104, 43) 100 food, Kaifeng on the deer
(21, 47) 100 food, Kansas City 1S of the horse
(22, 47) 102 food, Kansas a city 1SE of the horse
(21, 48) 101 food, Omaha on the horse
(22, 48) 100 food, Omaha 1E of the horse
(54, 49) 103 food, Tours on the uranium
(55, 49) 104 food, Orleans 1S of standard Paris
(55, 50) 102 food, Paris (standard)
(57, 51) 101 food, Aix-la-Chapelle
(58, 52) 101 food, Cologne on the cow
(59, 52) 107 food, Munster 1S of the horse
(59, 53) 100 food, Goslar on the horse
(66, 53) 102 food, Brest-Litowsk on the horse
(67, 54) 100 food, Wilno 1E of the wheat
(67, 55) 102 food, Polock 1NE of the wheat
(68, 55) 101 food, Novgorod 1NW of the pig
(If someone could graciously help me embed an image... I used "[#IMG]" (no #) but it doesn't appear to be working.)