Will we be needing an Altered Maps 2 thread?
Dunno if that is photoshopped in but it is funny non the less.
http://img138.imageshack.us/img138/791/theamericanworld9lt.jpg
Land area:
Description:
The size of each territory represents exactly its land area in proportion to that of the others, giving a strikingly different perspective from the Mercator projection most commonly used.
Amount of International Tourists:
Description:
The size of each country in this map is proportional to the number of visits from international tourists the country receives. As you can see, Western Europe, particularly France, Spain, and Italy, receive huge numbers of visitors, while South America and Africa have almost disappeared from the map.
Rail Travel:
Description: No surprise here. India, China, and Japan dominate this map, which seeks to compare countries based on the extent of their rail networks. As those visitors to South America can attest, if you want to get around, you'd better learn to love the bus.
Alcohol Consumption:
Description:
This map shows a country's total quantity of alcohol consumed. The Chinese, though not known as particularly heavy drinkers, still consume the most alcohol in the world. There are over a billion of them, after all. Notice the Middle East, which is largely Islamic and where alcohol consumption is verboten, can barely been seen on this map.
International Immigration:
Description:
The size of each territory indicates the number of international immigrants living there. The United States receives the highest number of international immigrants, while Andorra has the highest proportion - four out of five people in Andorra are immigrants. The Philippines and Guyuna have the lowest proportion - just one in 500.
Net incoming tourism:
Description:The size of each territory indicates the number of tourist trips made to that territory minus the number made from that territory to elsewhere.
Aircraft Travel:
Description:In this map, the size of each territory indicates the total distance flown by aircraft registered there.
Mopeds and Motorcycles:
The size of each nation indicated the total number of motorcycles and mopeds there. The largest number of motorcycles per person is in Malaysia and Greece - where there are more than one for every five people - closely followed by Thailand, Cambodia and Italy.
GDP in Year 1:
In Year 1900:
and in year 2015:
And now explanations:
Wealth in the year 1
The size of each territory shows the GDP, adjusted for local purchasing power, of the equivalent territory in 1 AD. The Americas appear small, partly because fewer people lived there in year 1 AD.
Wealth in the year 1900
The effects of the industrial revolution have become apparent here - the United Kingdom has the highest estimated GDP per person.
Projected wealth in the year 2015
China seems set to come full circle from 2,000 years ago. If estimates are correct, by 2015 China will be producing 27 per cent of the world's wealth, up from just five per cent in 1960.
Housing Price:
Description: The size of each territory shows the total value of all housing, adjusted for local purchasing power.
Western Europe contains the most expensive housing, while Africa and South Asia has the cheapest, even after allowing for the fact that money goes further here.
HIV Prevalence:
The size of each territory shows the number of people aged 15 to 49 with HIV. The highest prevalence exists in Swaziland, where 38 per cent of 15 to 49-year-olds carry the virus. More than a fifth of people in Botswana, Lesotho, Zimbabwe, South Africa and Namibia, within this age range, carry HIV.
Amount of Nukes per nation.
Armed forces at war since 1946:
Armed forces at war 1945-2004
The size of each territory represents the time spent by its armed forces fighting wars.
Russia and Israel top the list, followed by Nicaragua, Vietnam, Syria, Laos, France, Britain, Iraq and Afghanistan.
Amount of death in wars 1946-2002:
Note the disappearance of Russia, America and Western Europe. The most deaths as a percentage of the population occured in Cambodia, followed by Timor-Leste, Angola, Rwanda, North Korea and Afghanistan.
Amount of Carbon emissions.
Between 1980 and 2000, nearly three-quarters of all territories saw an increase in carbon dioxide emissions, with China, the United States and India leading the way.
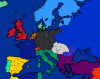
Decreases in Carbon Emissions between 1980 and 2000
Decrease in emissions of carbon dioxide
Between 1980 and 2000, 28 per cent of countries reduced their emissions. Almost half of reduction were made in territories of the former Soviet Union, while Germany (15 per cent), Poland (eight per cent) and France (six per cent) also made substantial cuts.
A couple of these Surprised me!
")


") AND thier prowerful lobbies...
AND thier prowerful lobbies... do you guys actually notice stuff like that? I'm sure the non-scottish/welsh would've been completely oblivious to sentenced like that.