- Home
- Forums
- CIVILIZATION IV
- Civ4 - Creation & Customization
- Civ4 - Project & Mod Development
- Civ4 - Caveman 2 Cosmos
- Bugs and Crashes
You are using an out of date browser. It may not display this or other websites correctly.
You should upgrade or use an alternative browser.
You should upgrade or use an alternative browser.
v21 bugs and crashes
- Thread starter Dancing Hoskuld
- Start date
It's rev2118 I'm on and seeing it at currently. As for reproducing: once a game is freshly loaded it seems to take a few turns before it happens again, so can't really. You'll just have to look for it in an own saved game (or borrow any odd one of the ones posted).
Cheers
Cheers
It's rev2118 I'm on and seeing it at currently. As for reproducing: once a game is freshly loaded it seems to take a few turns before it happens again, so can't really. You'll just have to look for it in an own saved game (or borrow any odd one of the ones posted).
Cheers
Catch 22. If it happens I need to be running a special debug build to be able to analyse it. Running with that version turn times are around the 15-20 minute mark, so I can't just play that way on the off chance

What I think I will do is add a dynamic key-sequence in the regular build to turn on path tracing. That will give a way to analyse it when it happens by turning on the tracing there and then and capturing it. I'll post detailed instructions when I do - the save game at the time + the trace should illuminate the issue then.
Koshling, here's my current game.
I'm pretty isolated atm and will have to wait for optics to expand further.
Turntimes on my laptop (i3, win7, 4GB Ram, decent Video card) are short of a minute.
Thanks in advance.
You're not halucinating.
However, it's nothing to do with crime. It's AI overhead in the new pathing that I have only done the first phase of. Looks like I need to do the second phase to get performance levels back in games with a lot of units, but I can't really do that before v22 (too risky and time consuming).
I'm looking at it now to see if there is anything simple I can do to help until I get phase 2 of the pathing rewrite done.
strategyonly
C2C Supreme Commander
I'm looking at it now to see if there is anything simple I can do to help until I get phase 2 of the pathing rewrite done.
OK, i tell you what, you give me, the OK, and then we'll go from there to post the next version, even if its 2 weeks from now, hows that

Koshling, here's my current game.
I'm pretty isolated atm and will have to wait for optics to expand further.
Turntimes on my laptop (i3, win7, 4GB Ram, decent Video card) are short of a minute.
Thanks in advance.
Turns out that I was only partially correct about the pathing changes being at the root of it. Basically the new pathing is about 20% slower than the old (until I get to phase 2, after which it'll be faster). In most game turns pathing accounts for around 25% of the total turn time, so the new pathing is costing us about 5% (which I deemed acceptable for this release, and phase two work will happen as soon as v22 is out).
However, in some circumstances, inefficiencies in the USE of the pathing engine (not its implementation) mean that a lot more path generation is requested than normal (and of a lot longer paths). It was these cases, which have been in the code for a very long time, which we're being amplified by the pathing change. DRJ's example was actually more pronounced than yours, so I ended up using his save as my test case for profiling after verifying that both profiles showed the same effect (though yours less so). In DRJ's save pathing calculations were well over half the turn time, so adding an extra 20% to that was amplified accordingly.
I have now eliminated the worst causes of this that the saves pointed out, though some of the lesser causes will probably warrant further work at some future point.
For comparison (and because DRJ asked about profiling generally), I have attached before and after profiles of the same end turn in DRJs stuck-unit save position. You'll need Excel or some other spreadsheet that can read Excel files to view these if you're interested.
Each spreadsheet is just output from the profiler logging, which I've sorted in Excel by time, so that the most time consuming functions are at the top. Each row has the following columns:
Fn: name of a function that has a profiling point associated with it in the code
Time: time spent executing that function within the end turn execution (in milliseconds). This includes time in funtions that this one calls, and their descendants.
Avg Time: average time per call
#Calls: number of times that function was called
Child time: time spent in calls made by this function
Self time: (time - child time) - so time spent in this function itself
Parent: first seen caller of this fucntion in the call tree
As you can see from the results, the main offender is pathing (CvSelectionGroup::generatePath) taking over 90 seconds in the base (before fix) profile, but more important is where many of those calls were from. The noteable functions that are hot here, and would not be expected to contribute so much, are CvUnitAI::AI_Group (taking 45 seconds, mostly in its path generation), and AI_pickTargetCity (taking 20). AI_counterMove() calls AI_Group() which is why it is high (it's AI_Group() that is the fundamental offender), and similarly AI_attckCityMove() calls AI_pickTargetCity().
Anyway, turning to the second profile, you'll see that I managed to reduce the 40 + 20 seconds to a more reasonable 2.2 + 0.2.
And thx for explaining how you find the hot spots, would you mind making a documentation about that at some time, maybe? Like how to use a profile build for analyzing?
I like thebtw. makes it easier to understand^^
- style
I'll post something in the modders documentation section sometime on how to use the profiling build.
DRJ
Hedonist
Thx so much for the inside info. You're doing a great job profiling and optimizing the code, can't write that often enough! A Sticky thread about self-profiling (like how to use SVN) would be really cool. So in the end we save you time with the profiling and you could concentrate totally on coding...
Great my save was of help and this quote sounds awesome!
Great my save was of help and this quote sounds awesome!
Anyway, turning to the second profile, you'll see that I managed to reduce the 40 + 20 seconds to a more reasonable 2.2 + 0.2.
strategyonly
C2C Supreme Commander
Dont know what this actually is: But here is whats happening.
In enemy territory i have a Wardog scouting the territory and when it STOPs its turn, is goes invisible
But the beginning of the next turn its there again, then at end, gone again??
In enemy territory i have a Wardog scouting the territory and when it STOPs its turn, is goes invisible
But the beginning of the next turn its there again, then at end, gone again??
I sometimes see different graphics presented for the same unit during a turn, AI Barb crocs are represented correctly, move as knight model, and end their move as a croc, then it may bea croc or a night when next seen static, a number of animals have this dual art image, might move as a elephant and rider and attack as an elephant, and manualy re patching solved it.
Might be related to what your seeing.
Might be related to what your seeing.
JosEPh_II
TBS WarLord
@Hanny,
When what you are seeing starts occurring it generally indicates that your video card and/or vid memory is reaching it's max. We've seen this behavior before and 90% of the time it's hardware reaching it's limits.
If you are Running under Game Options, "High" Graphics settings you may need to lower them. If you are already using low it might be time for a better video card.
I've been thru this myself.
JosEPh
Iirc that is an issue with one of the lowered graphic settings like frozen animation or something.I sometimes see different graphics presented for the same unit during a turn, AI Barb crocs are represented correctly, move as knight model, and end their move as a croc, then it may bea croc or a night when next seen static, a number of animals have this dual art image, might move as a elephant and rider and attack as an elephant, and manualy re patching solved it.
Might be related to what your seeing.
The American (AI) great commander doesn't move on end turn and the barb doesn't seem to care. Somethings off here.
View attachment 316659
View attachment 316660
The fix I made for DRJ fixed half of this (GG now tries to retreat to a city to find friends). The other half was old BTS code that I'm not sure of the purpose of, but its effect was to prevent city defnse stack making attacks on defenceless enemies! I have chnaged it so they are now merciless
")
Stormwind
King
- Joined
- Dec 7, 2008
- Messages
- 697
Iirc that is an issue with one of the lowered graphic settings like frozen animation or something.
Correct
Dancing Hoskuld
Deity
Metropolitan Admin cannot be built in the same city as the Palace.
Yes. We (Hydro and I) have been trying to get the admin buildings to work right. There was no benefit for building the Metropolitan and Capital Admin in the same city. So we were going to make them the same but not allow the Metropolitan one in the same city as your palace and change the capital Admin to a normal building that required the palace rather than a national wonder. Both would also have the same specs.
Looks like we did not finish the conversion for some reason.
I realized eventually the Capitol Admin is available, but it requires rep democracy instead of social contract and that is pretty confusing.
Also, more of a balance issue, but early game hunters that you later promote to big game hunters will often have a huge number of promotions both from combat and just gaining a lot of experience, so many that they can be nearly unstoppable by a civ that doesn't also have access to a 15 power unit.
One last thing, monks can get a lot of bonus experience when built, but they can't take any promotions so it doesn't do anything.
Re-posting of Persisting Bug:
Administration buildings: When upgrading an Administration building to the next step the specialists the new one gives are added onto what the old one gave. Village Hall to Town Hall gives a total of 3 specialists instead of 2. Come to think of it, as I've always just recalculated (now that that is possible) I don't know if the maintenance also stacks. Will have to check that next time I upgrade one.
River Authority buildings: When upgrading a River Authority building the extra commerce from river tiles stack rather than replace. When upgrading a River Port to River Authority it increases river tile commerce by 3 instead of 2. Recalculating fixes, of course, but should still not happen.
Will remember to check if any other benefits/penalties also stack.
Those are the ones I've noticed. When I have a chance I'll check the Boatyard to Marina combo, see if that stacks too.
Cheers
Hydromancerx
C2C Modder
River Authority buildings: When upgrading a River Authority building the extra commerce from river tiles stack rather than replace. When upgrading a River Port to River Authority it increases river tile commerce by 3 instead of 2. Recalculating fixes, of course, but should still not happen.
Will remember to check if any other benefits/penalties also stack.
This is weird. I do not know why it would do this. If i set them all to 1 then the stacking should come out correct, however it would appear not to be an upgrade if i did since they would all have the same stats.
Perhaps AIAndy knows why <RiverPlotYieldChanges> stacks.
Code:
			<RiverPlotYieldChanges>
				<iYield>0</iYield>
				<iYield>0</iYield>
				<iYield>1</iYield>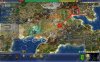
</RiverPlotYieldChanges>I have some messed up pathing that I think you might enjoy.
The scribe and or colonist in this save file, (near memphis) want to go across 36 steps of water to go 6 squares down. See pic and attached save game.
---------------
Upon moving some other units it self corrected the path the next time it cycled to them. SOO you might not be able to reproduce this if your not lucky.
Attachments
Similar threads
- Replies
- 1
- Views
- 320
- Replies
- 2
- Views
- 281
- Replies
- 26
- Views
- 8K
- Replies
- 1
- Views
- 442