[RD] Daily Graphs and Charts

Status
Not open for further replies.
"Lead time bias occurs when testing increases perceived survival time without affecting the course of the disease."
777px-Lead_time_bias.svg.png
 
Good thing we have lots of unused rooftops!
 
I actually think wind turbines look pretty. :3
 

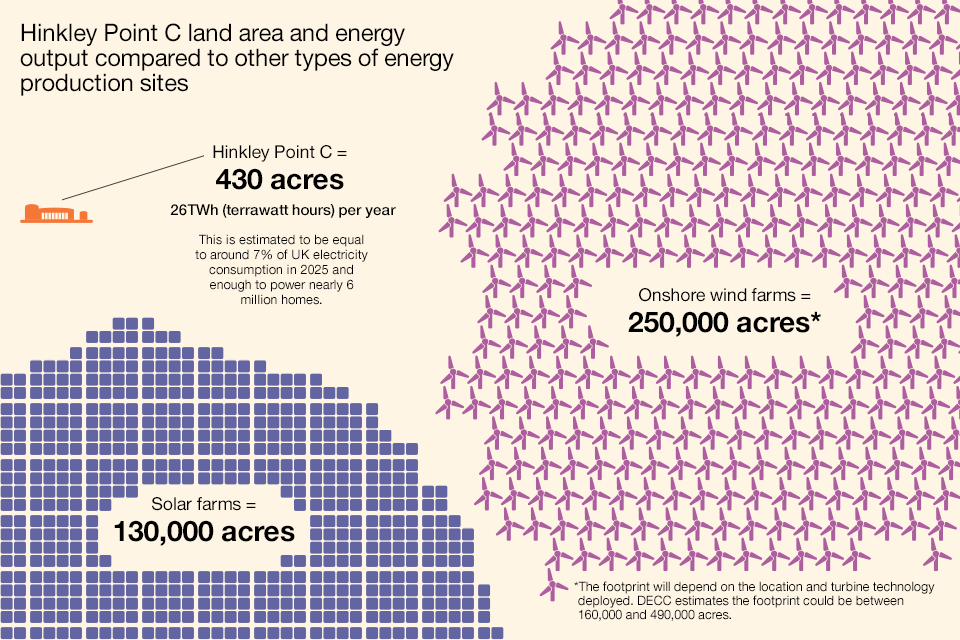
This is graph is misleading and not taking many things into account. The most important is the land area affected by a nuclear meltdown. I'm sure that's going to be a lot more than that of the solar or wind. Also, the solar could be put on rooftops or low land use locations. The wind turbines can be either offshore or integrated with farmland.
 
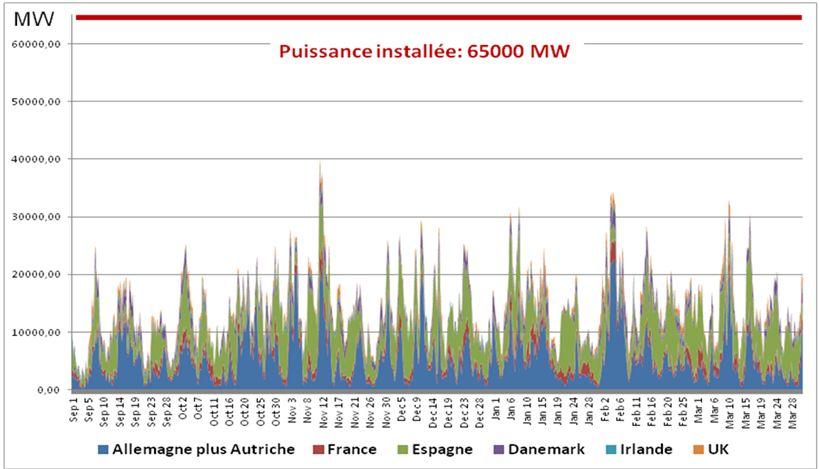
One thing that regularly comes up in wind energy/renewables discussions is the problem of intermittency.

For wind power this becomes a much, much less severe problem when considering scales of >=1000 kilometers

1-s2.0-S0301421505002752-gr5.jpg


hf-jpp_07.jpg


For the West European winter it looks like the total wind power output is below half the average output for less than 10% of the time, with a minimum output of about 20% of the average. (Capacity factor was 21%, average output about 13.5GW)

Should work similar for US or Australia.


For the summer, even continental scale interconnected solar would likely need more capacity, peak output and cycle durability of storage, though.

gesamtertrag-aktuell2.jpg


gesamtertrag-schwankung-aktuell.jpg

(daily averages, modeled values for Europe, with the weather of past years)
 
well then
 
Really? It seemed highly plausible to me. What do you find wrong?
 
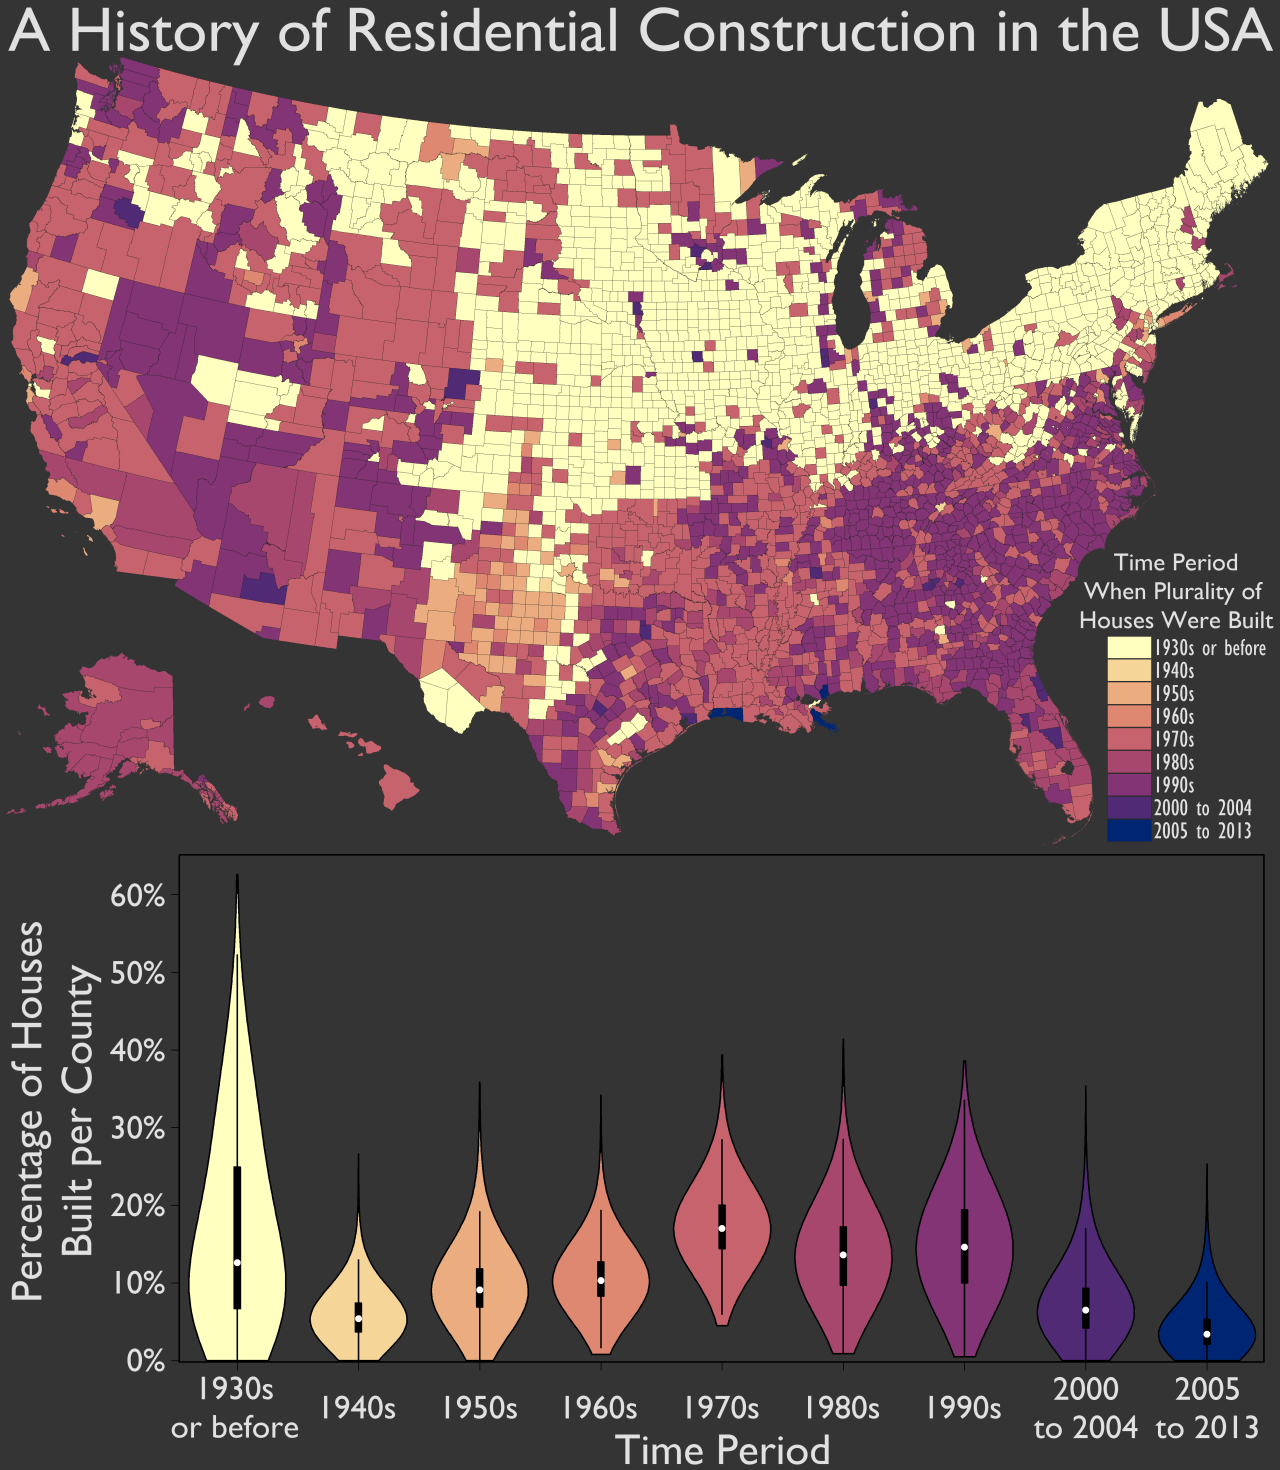
Most of the Northeast and rustbelt is showing a plurality of housing built before 1930. Now maybe they're using the term "plurality" in a way that it wouldn't occur to me to use it. But the suburbs really didn't get their start in a big way until the 1950s. And the national population has tripled since then while at the same time the average household size has gone way down, meaning greater numbers of residential units per capita.
 
Plurality meaning the "1930s and before" category is larger than any decade since. It's quite plausible that, say, 20% of the houses in the northeast were built then.
 
Status
Not open for further replies.
Back
Top Bottom