Aroddo
Emperor
Found a highly interesting piece of data visualization here.
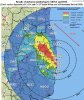
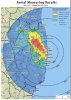
So, when visualizing the Fukushima radiation on a map, very often the following map is shown. It depicts the radiation measured 2 weeks after the disaster - an the reactor leaked for months after that.

Fukushima is always described as the worst nuclear accident since Chernobyl, so here the radiation map of Chernobyl for comparison. It decpits the fallout two weeks after the accident, when the leaking was already stopped.
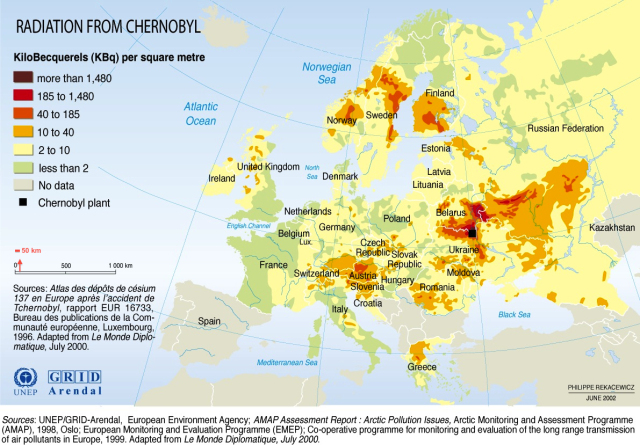
On first glance, the Chernobyl fallout is far more widereaching than the Fukushima fallout ... but if you look closely at the scale used in both graps you can see how the Fukushima map uses soothing green colors for contamination levels that would appear in deep red on the Chernobyl map.
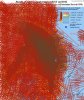
Or to put it another way - If you draw the Fukushima fallout map with the color codes used in the Chernobyl map, the result would look something like this:

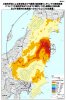
And if projected on the whole of Japan:

It should be quite obvious that the fallout region is significantly larger than depicted here ... japanese authorities simply didn't bother measuring or releasing data from the surrounding regions in the "safe" zone.
But how big is the Fukushima disaster really?
Well, a quick look on the Chernobyl map clearly shows that the effects were felt throughout of Europe, even though the measured radiation was on several scales lower than that of the Fukushima incident.
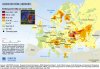
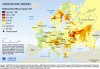
To give you a sense of the size of the contaminated region in comparison to Europe:

The only saving grace of Fukushima is that the wind blew towards the pacific ocean the entire time (US west coast: beware).
Fukushima isn't the largest nuclear accident since Chernobyl - it's the largest nuclear accident ever! It's really just a matter of time when the next one happens.
You might want to check radiation maps before visiting the Olympic Games in Tokyo 2020.
edit:
Another map of the fukushima region with Chernobyl color codes:

added high resolution version of first map
So, when visualizing the Fukushima radiation on a map, very often the following map is shown. It depicts the radiation measured 2 weeks after the disaster - an the reactor leaked for months after that.
Fukushima is always described as the worst nuclear accident since Chernobyl, so here the radiation map of Chernobyl for comparison. It decpits the fallout two weeks after the accident, when the leaking was already stopped.
On first glance, the Chernobyl fallout is far more widereaching than the Fukushima fallout ... but if you look closely at the scale used in both graps you can see how the Fukushima map uses soothing green colors for contamination levels that would appear in deep red on the Chernobyl map.
Or to put it another way - If you draw the Fukushima fallout map with the color codes used in the Chernobyl map, the result would look something like this:
And if projected on the whole of Japan:
It should be quite obvious that the fallout region is significantly larger than depicted here ... japanese authorities simply didn't bother measuring or releasing data from the surrounding regions in the "safe" zone.
But how big is the Fukushima disaster really?
Well, a quick look on the Chernobyl map clearly shows that the effects were felt throughout of Europe, even though the measured radiation was on several scales lower than that of the Fukushima incident.
To give you a sense of the size of the contaminated region in comparison to Europe:
The only saving grace of Fukushima is that the wind blew towards the pacific ocean the entire time (US west coast: beware).
Fukushima isn't the largest nuclear accident since Chernobyl - it's the largest nuclear accident ever! It's really just a matter of time when the next one happens.
You might want to check radiation maps before visiting the Olympic Games in Tokyo 2020.
edit:
Another map of the fukushima region with Chernobyl color codes:
added high resolution version of first map
Attachments
-
 fukushima_cesium_map_becquerels_april29_2011_inchernobylslegendcolors_mvb.jpg155.3 KB · Views: 1,441
 -
 japan_andregion_fallout_mostly_no_data_mvb_1000_estimates.jpg68.7 KB · Views: 1,332
 -
 japan_mext-doe_overlayon_unep_chernobyl_001_april_1986_mvb_annot2.jpg131.4 KB · Views: 1,580
 -
 met_doe_fukushima_cesium_map_becquerels_april29_2011_mvb-annot1.jpg335.5 KB · Views: 168
 -
 unep_chernobyl_001_april_1986_mvb_annot1_redux.jpg272 KB · Views: 2,686
 -
 fukushima_cs137_only_unepcolors_mvb2011.jpg241.2 KB · Views: 1,528
 -
 fukushima_180511.jpg254.6 KB · Views: 11,380
