robk
Warlord
Hey.
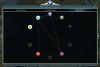
I was on Sins of a Solar Empire, a space real-time stratergy, earlier today, and it gave me an idea that you might consider adding to your to-do list. They have these graphs that display at the end, they have it for all but a few aspects of the game, from your current currency levels, your extraction rates, your fleet capacity, fleet used, capital ship levels.
Anyway, when you hover over any part of the graph, a kind of mouse-over pop up that displays the figures to each player in order from best to worse on any part of the graph. I thought it was a little handy as there was less guess-work involved in the figures you're dealing with.
I was considering against it, though, as I don't know how Civ coding really 5 works and that it might take up alot of memory in adding this feature...
Your thoughts?
-Kris
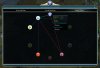
Earlier, I had given thought to adding tooltips to each of the graph segments but two things held me back: the lines are really teenie and those tooltips would be constantly changing with the slightest movement as you move the mouse around and I don't know how the civ5 engine, as you said, would handle a thousand or so of those things in the same space.
What you're talking about is a little more simple. It sounds like there would be one tooltip for each x-axis point listing all the values at that time. It sounds pretty cool and, I think, fairly simple to execute. I'll give it a try in development to see how well it turns out and, if it looks good, I'll add it in.
Thanks for the idea

")