[RD] Daily Graphs and Charts

Status
Not open for further replies.
I never liked using mine, but seeing some graphs certainly make me want to.
 
The ignore list is for the weak willed. I don't use it out of principle and as a measure testing my self-control. If I can avoid giving in to temptation to reply, or getting angry at posters, then I have achieved something.
 
The ignore list is for the weak willed. I don't use it out of principle and as a measure testing my self-control. If I can avoid giving in to temptation to reply, or getting angry at posters, then I have achieved something.

It's really easy to not get angry and not reply at obnoxious posters. It's just really nice to not have to read consistently noncontributing, loud personalities that dominate discussions. You're giving more attention to more deserving posts and posters.
 
There are 100% less charts and graphs on this page than most of the rest of this thread.
 
Let's fix that, shall we?

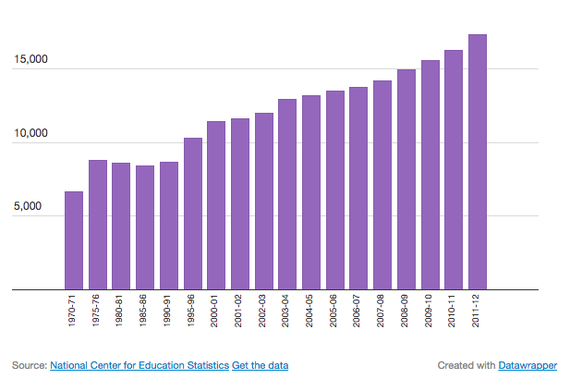
Master's Degrees Earned in Visual and Performing Arts in the US
3440dd4e8.png
 
The previous chart I posted compared % and types of R1a among various Slavic group.

This data below does not take into account overall amount of R1a, but only its composition.

So in case of each group R1a is 100% and the graph shows how large % of R1a is each subclade:

R1a_composition.png


Russians of Kostroma seem to be the most "average" Slavic group when it comes to proportions of R1a types.

https://en.wikipedia.org/wiki/Kostroma

But on the other hand, Ukrainians from Donetsk have the most even proportions (roughly 1/3 + 1/3 + 1/3).

A very interesting correlation can be seen (with only a few exceptions):

[WeS] - West Slavs
[EaS] - East Slavs
[SoS] - South Slavs

And this correlation (there are a few exceptions, as you can see below) is as follows:

West Slavs = more of M458
East Slavs = more of Z282
South Slavs = more of M558

Group (Z282 / M458 / M558 / other - as % of total R1a):

[WeS] Czechs----------------------------(10,1 / 79,8 / 10,1 / 0,0)
[WeS] Czechs Utah----------------------(0,0 / 70,0 / 19,9 / 10,1)
[SoS] Croatia mainland-----------------(16,0 / 68,0 / 16,0 / 0,0)
[EaS] Ukrainians Cherkassy-------------(22,4 / 53,1 / 24,5 / 0,0)
[WeS] Poland----------------------------(4,0 / 58,0 / 38,0 / 0,0)
[WeS] Slovakia--------------------------(4,1 / 46,2 / 48,0 / 1,7)
[SoS] Bulgaria---------------------------(10,8 / 42,0 / 40,4 / 6,8)
[WeS] Poles Wroclaw-------------------(17,6 / 43,2 / 39,2 / 0,0)
[EaS] Ukrainians Ivano-Frank.----------(8,1 / 40,0 / 51,9 / 0,0)
[EaS] Belarusians Brest-Lit.------------(15,8 / 38,6 / 45,6 / 0,0)
[EaS] Russians Kostroma---------------(18,9 / 37,4 / 43,7 / 0,0)
[EaS] Ukrainians Donetsk---------------(30,4 / 30,4 / 37,0 / 2,2)
[EaS] Russians Pskov-------------------(37,1 / 25,8 / 35,5 / 1,6)
[EaS] Belarusians-----------------------(38,4 / 23,2 / 38,4 / 0,0)
[EaS] Ukrainians Belgorod--------------(49,9 / 11,6 / 38,5 / 0,0)
[EaS] Ukrainians Khmilnyk--------------(39,4 / 15,7 / 44,9 / 0,0)
[EaS] Russians Belgorod----------------(25,9 / 18,8 / 55,3 / 0,0)
[EaS] Russians Oryol--------------------(25,0 / 23,6 / 51,4 / 0,0)
[SoS] Serbia-----------------------------(17,9 / 23,2 / 47,0 / 11,9)
[SoS] Macedonia------------------------(18,0 / 27,3 / 54,7 / 0,0)
[SoS] Bosnia----------------------------(19,8 / 19,8 / 60,4 / 0,0)
[SoS] Slovenia--------------------------(0,0 / 10,7 / 83,9 / 5,4)
[SoS] Herzegovina----------------------(6,2 / 6,2 / 87,6 / 0,0)

BTW - resemblance between Czechs and mainland Croats is striking. As if they were one group that split in two.
 
You should compose a rhapsody.
 
More importantly, it seems that Macedonians are more Serbian than Bulgarian. :)

All in all, a continuum is visible, with West Slavs being on one extreme, most of South Slavs on the opposite extreme, and East Slavs in the middle. East Slavs are clearly the most diverse in terms of proportions of subclades of R1a.

This kind of result seems to support the theory that Slavs migrated from East to West and South.

Croats for sure and perhaps some other South Slavs confirm that West Slavs also migrated south to the Balkans.

The Croat-Czech resemblance is very close.
 
OK, I rather wanted to write "more surprisingly", not "more importantly". Another thing is, that Macedonians do not have as much of R1a (see my previous graph, at the bottom of previous page) as Bulgarians. So not only Bulgarians have quite different proportions of various types of R1a than Macedonians, but also they have more of it in total.

Among all Slavic groups only Herzegovinians have less R1a than Macedonians.
 
Given that - for example - Russians from Kostroma and Russians from Oryol are both people of the same ethnicity (namely: Russian), I fail to see how does this graph relate to ethnicity ??? Rather to possible origins and patterns of ancestral migrations, mixing and admixtures, leading to modern ethnic groups.

Also you display your weird definition of ethnicity again. Contrary to what you suggest, ethnic groups are socially defined categories (wiki):

I'm getting at a result, not the starting point.

Hello. I'm back and I have also discovered this amazing tool called "ignore list".

http://m.youtube.com/watch?v=5hR5YNqE3K8
 
^ Dear, oh dear. The UK would love to suffer from this sort of problem. It's a nightmare for me to find a parking space anywhere but my own front drive.

Still, I can appreciate the problems that too many parking spaces brings.

Roll on the day when private vehicles are a thing of the past.
 
B. procyonis, also known as raccoon roundworm.
B.procyonis_life_cycle.jpg
 
What the hell is going on with English-Americans ???:

http://forums.civfanatics.com/showthread.php?p=13610714#post13610714

The first US census in which question about ancestry was asked was that of 1980.

Here is how the numbers for several ancestry groups were changing from 1980 to 2010:

English ancestry in the USA (self-reported):

1980 - 49,60 million
1990 - 32,65 million
2000 - 24,51 million
2010 - 25,93 million


Ancestry.png
 
Status
Not open for further replies.
Back
Top Bottom