The general thing of people defending their privileges happens all the time, but forcing banks to invest in certain industries is a new one on me. It sounds very anti-free market. It kind of seems that if this really was "woke financial institutions" then there would be opportunities for non-woke money to pick up lucrative deals. The fact that the are trying to alter the playing field with legislation rather than the Koch brothers picking up these missed opportunities really speaks of something rotten.Happens in all kinds of groups, structures, etc and happens all the time.
You are using an out of date browser. It may not display this or other websites correctly.
You should upgrade or use an alternative browser.
You should upgrade or use an alternative browser.
Global warming strikes again...
- Thread starter CavLancer
- Start date
The general thing of people defending their privileges happens all the time, but forcing banks to invest in certain industries is a new one on me. It sounds very anti-free market. It kind of seems that if this really was "woke financial institutions" then there would be opportunities for non-woke money to pick up lucrative deals. The fact that the are trying to alter the playing field with legislation rather than the Koch brothers picking up these missed opportunities really speaks of something rotten.
But "free market" is a slogan for a banner.
Not something the privileged really stick to when it is not usefull for themselves.
And "free market" sells good because it works fairly well for small entrepreneurial businesses, the mom and pop shops, from pubs, small shops, medical & mental care small "companies" (like dentists, GPs etc) up to industrial and business services. Also because the consumer or client has more real alternative choices and elected authorities can easier apply meaningful regulations on them.
The more monopoly effects you have from specialist products and from bigger companies, the less "free market" functions.
Is all in all a gliding scale.
Free market has I think developed in the world very much like a religion and the voters see that free market principle very much like having a lot of "different" shops to buy from in their daily life. Something they want.
Some less blind faith of part of the masses would at least give the power to authorities to get better regulations against the powerful big companies.
BTW my understanding of the real word is that banks are since time immemorial always pressured to invest more or against less interest for activities that are considered best for the country as the elite sees it.
But the current (in this case fossil) elite being threatened removes the velvet gloves.
EnglishEdward
Deity
... forcing banks to invest in certain industries is a new one on me....I
I think that this is hardly likely to happen in the USA, where the banks control the legislators!
We were talking about how to account for the emissions of internationally traded goods. The world in data has a special on that.
I am surprised Russia and South Africa are darker blue than China.

I am surprised Russia and South Africa are darker blue than China.
We were talking about how to account for the emissions of internationally traded goods. The world in data has a special on that.
I am surprised Russia and South Africa are darker blue than China.
Do mind that the yardstick is traded divided by domestic consumption
A country with low domestic consumption (low gdp per capita) gets higher %
Perhaps South Africa can also be explained by the gold mining and exporting that (China for example keeps its mined gold and even buys a lot globally).
Mining is in general a very energy intensive activity and because gold is stranded (not close to existing logistics), you need lots of infra with roads (embodied energy!). Machines, trucks all very big with wear & tear (embodied energy). Pulverising rock energy intensive.
The gold price is not that much higher than the cost (being lots of embodied energy). Here from 2011 (a lower gold price than now): https://www.coindesk.com/markets/2014/06/28/under-the-microscope-the-true-costs-of-gold-production/
Angst
Rambling and inconsistent
That map is also why I get so ticked off when my countrymen act high and mighty, pretending we're bestest green and shouldn't do anything (Denmark)
Russian exporting gas to West Europe ?
AU export coal and iron ore.
To me for Russia that fossil export looks like a contributor as well.
If that analysis also counted leaked energy from leaked natural gas mining you get easy high energy. That leaked gas being methane even having a higher greenhouse effect than just energy.
I read this, and it is amazing how bad beef is. I have been rationalising eating beef offal sold as dog food, arguing with myself that meat diverted from the animal food chain is better than that directed at humans, but if it is that bad then I any support for that industry has to be a bad thing:
Poultry and pork better that ovo-lacto vegetarian:
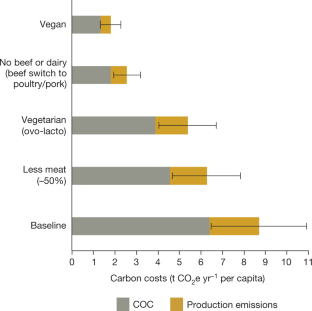
Fig. 3: Carbon costs of different diets based on the carbon benefits index.
Petrol better that biofuels (why did the UK government force us to go 10% ethanol?)

Fig. 2: Carbon costs of different fuel sources (per kilometre driven) based on the carbon benefits index.
I do not quite get the difference between these maps, but I am sure they mean we should be protecting the tropical rainforests and the northern tundras
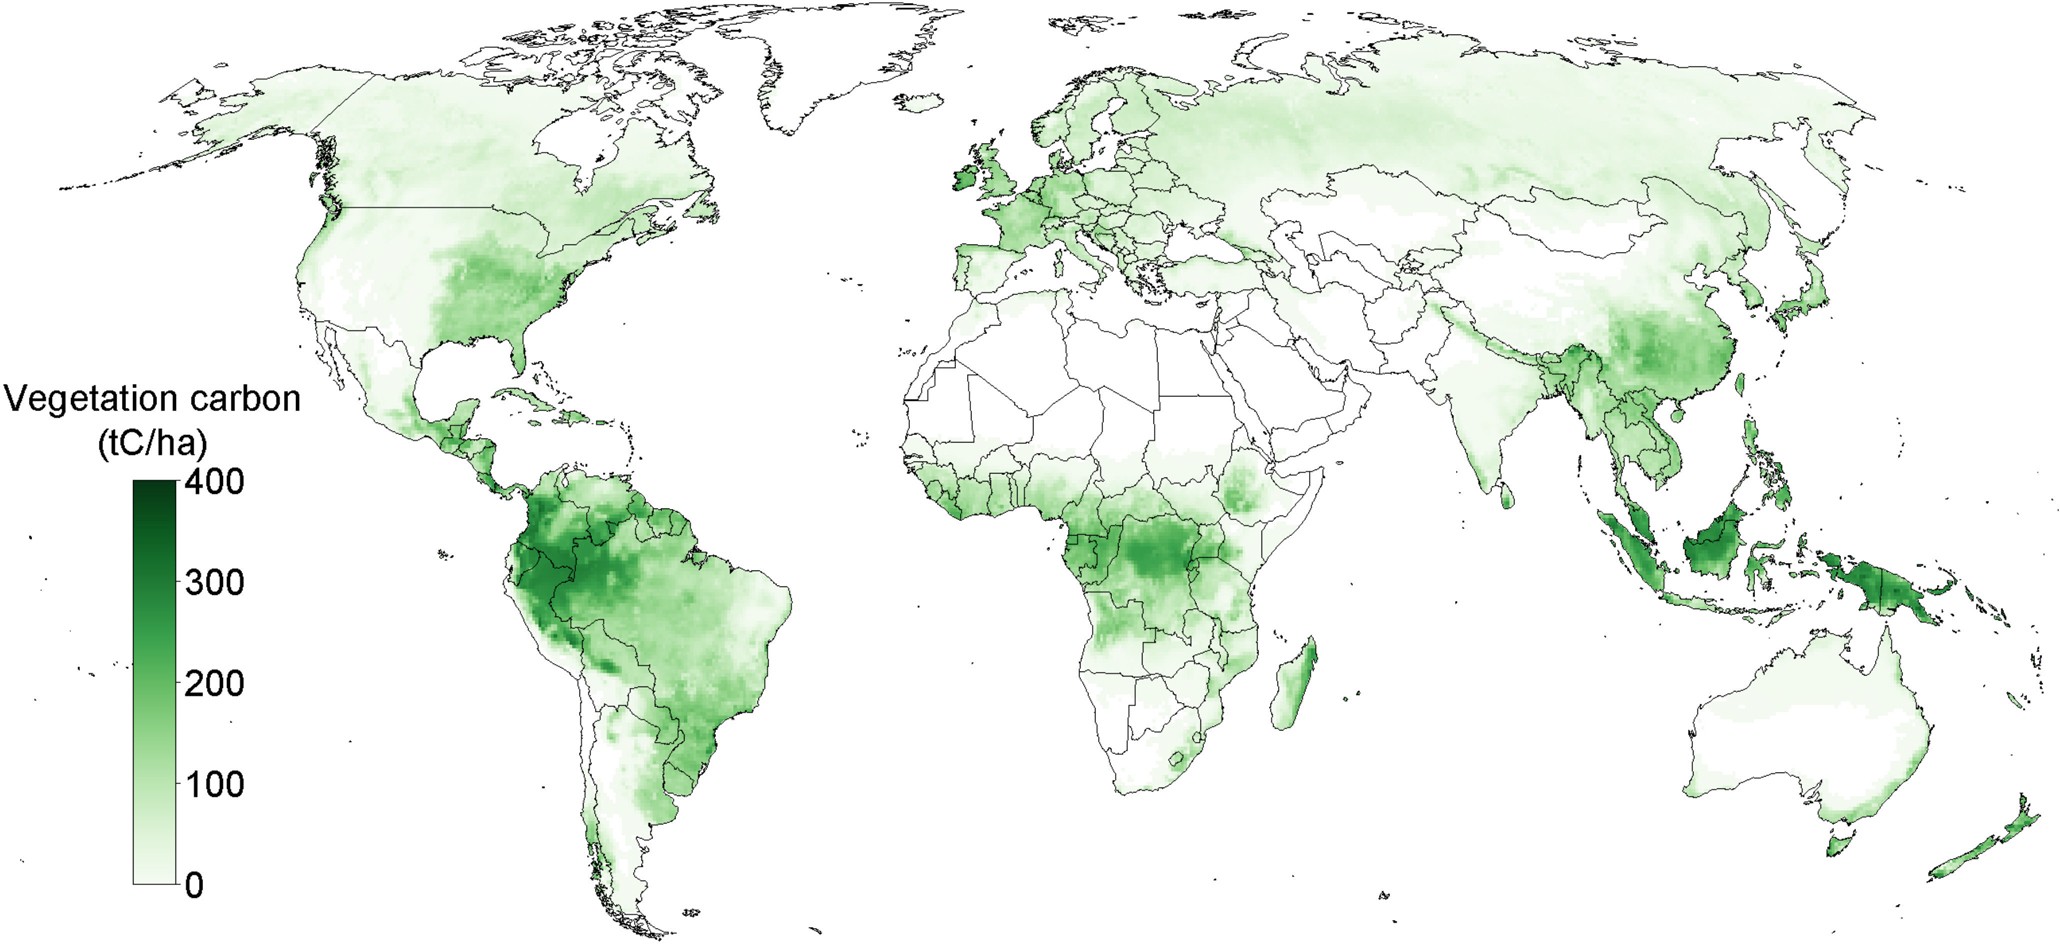
Extended Data Fig. 3 Above- and below-ground carbon stocks of potential natural vegetation under current climate, used to derive COCs with the carbon loss method.
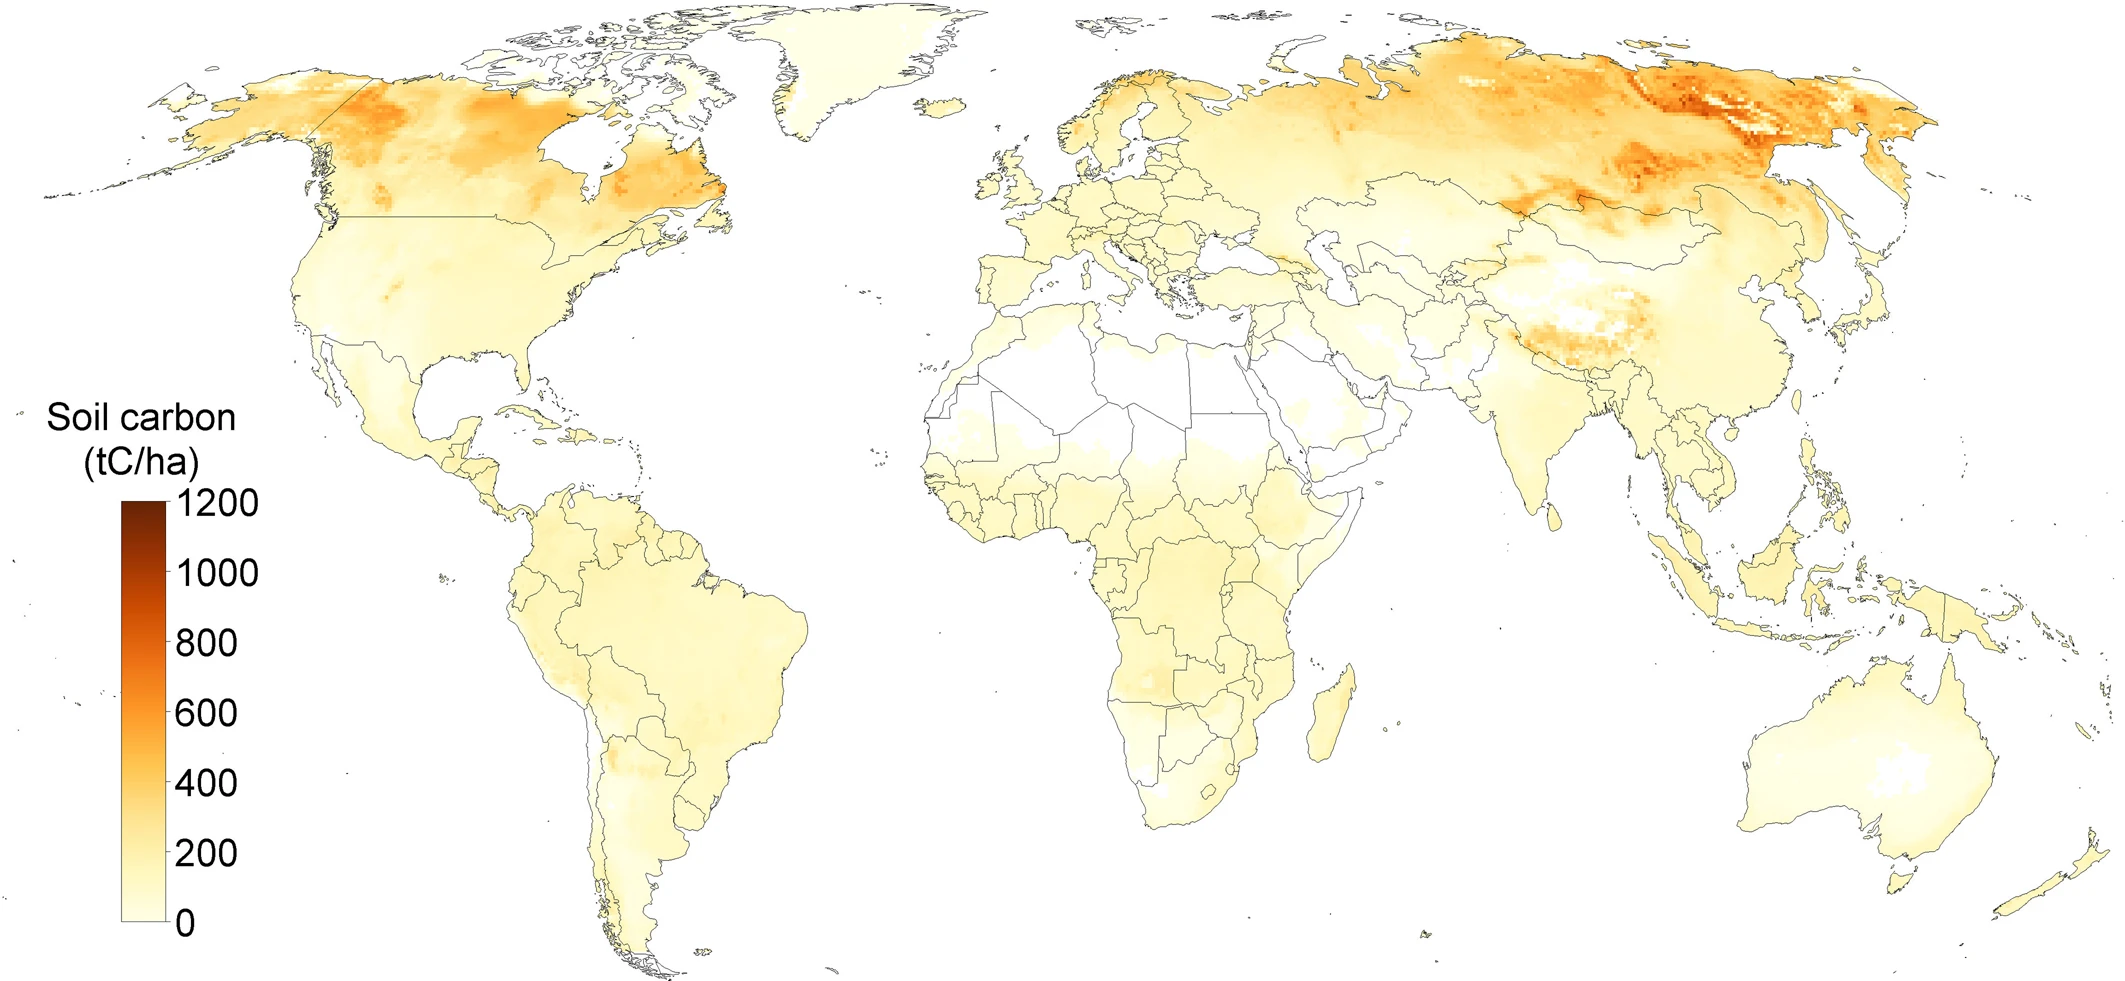
Extended Data Fig. 4 Soil carbon stocks of potential natural vegetation under current climate used to derive COCs with carbon loss method.
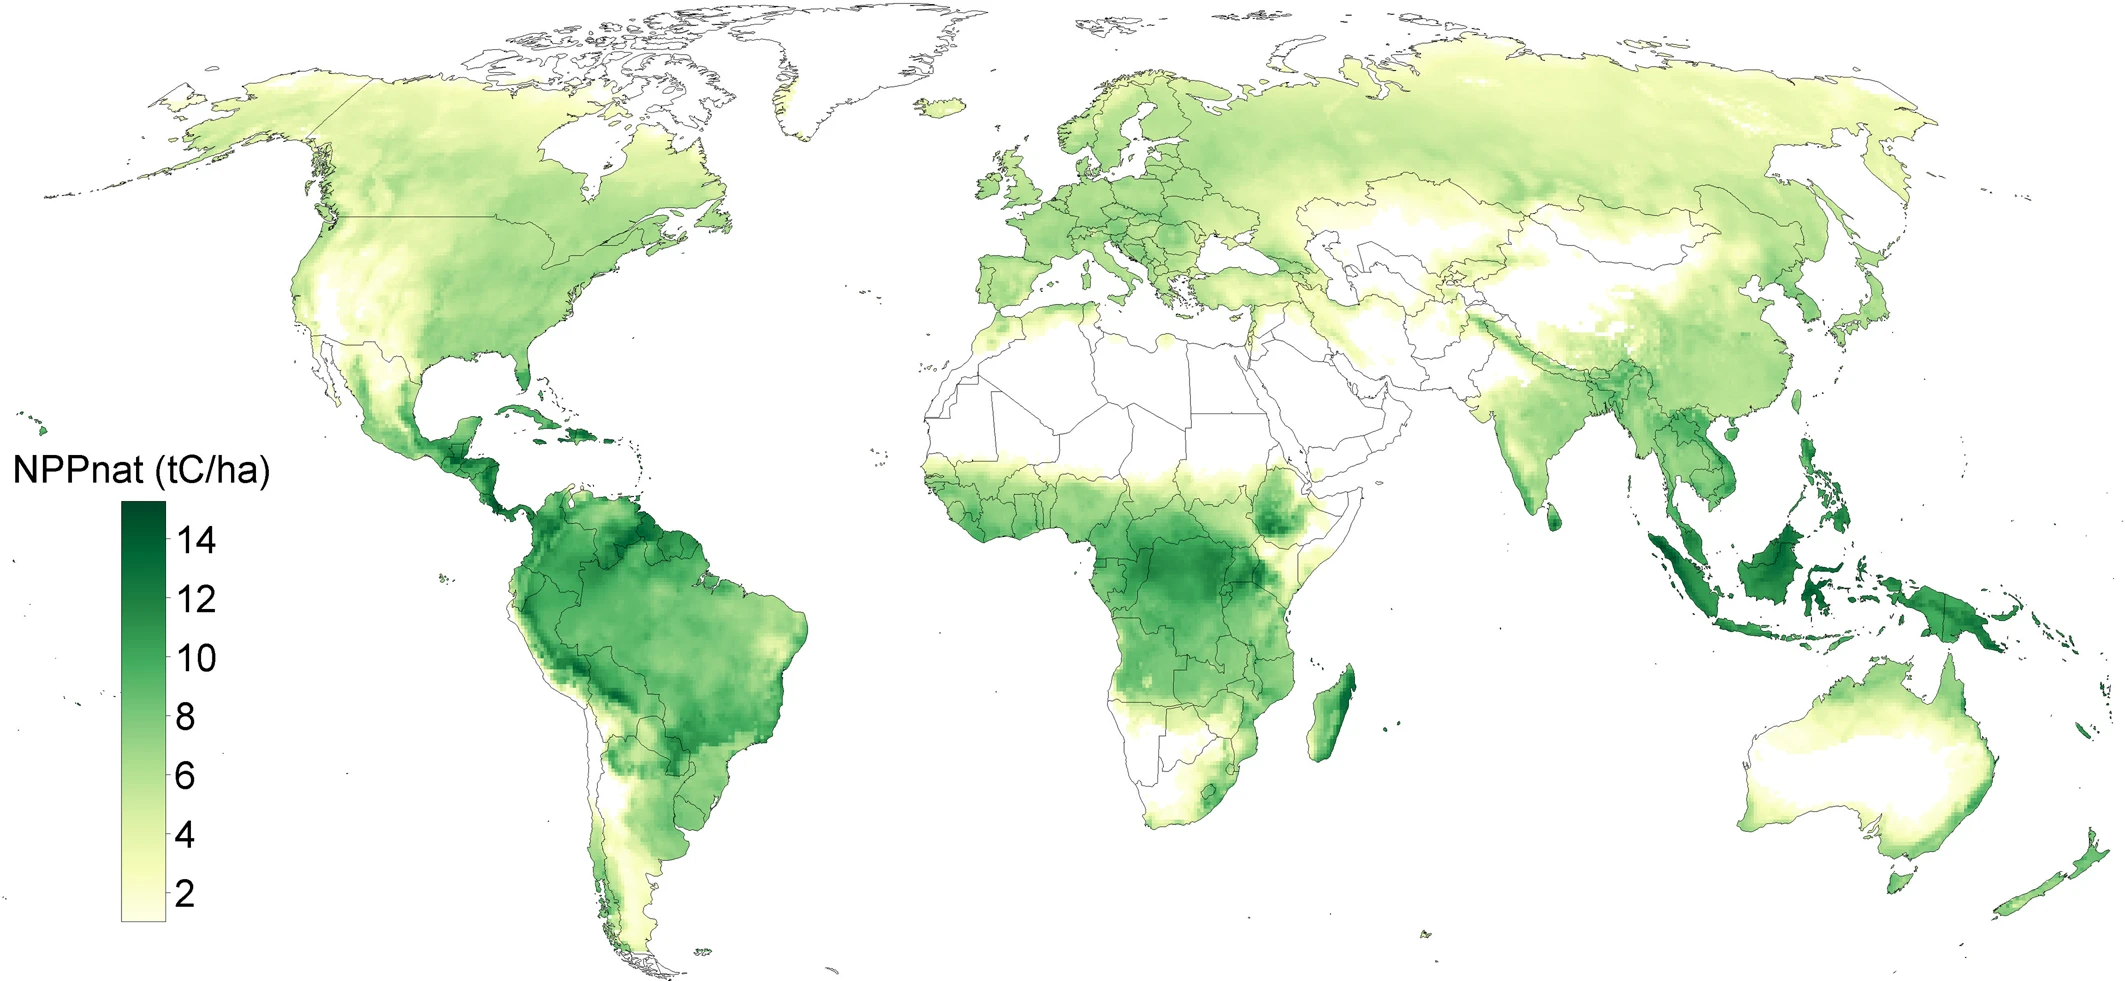
Extended Data Fig. 5 Annual net primary productivity of potential native vegetation under current climate used to derive COCs with carbon gain method.
Extended Data Fig. 1 Carbon benefits of different crop production systems based on the carbon benefits index. I cannot figure this out, is more good or not?
In a paper in Nature last year, a team led by Timothy Searchinger of Princeton University examined the impact of various foodstuffs in terms of carbon. This shows that protein from beef is 73 times worse than protein from soya.
A kilogram of beef protein has the equivalent carbon emissions of a passenger flying from London to New York and back. The overall carbon cost of 1 kilogram of beef protein is equivalent to 1250 kg of CO2. Aircraft emissions for long-haul flights are roughly 110 grams per passenger per kilometre, and the return distance is 11,170 km – so 1229 kg of CO2.
Then I looked at the paper, and some other things surprised me (COC = carbon opportunity cost):A kilogram of beef protein has the equivalent carbon emissions of a passenger flying from London to New York and back. The overall carbon cost of 1 kilogram of beef protein is equivalent to 1250 kg of CO2. Aircraft emissions for long-haul flights are roughly 110 grams per passenger per kilometre, and the return distance is 11,170 km – so 1229 kg of CO2.
Poultry and pork better that ovo-lacto vegetarian:
Fig. 3: Carbon costs of different diets based on the carbon benefits index.
Petrol better that biofuels (why did the UK government force us to go 10% ethanol?)
Fig. 2: Carbon costs of different fuel sources (per kilometre driven) based on the carbon benefits index.
I do not quite get the difference between these maps, but I am sure they mean we should be protecting the tropical rainforests and the northern tundras
Spoiler Three world maps of soil carbon :
Extended Data Fig. 3 Above- and below-ground carbon stocks of potential natural vegetation under current climate, used to derive COCs with the carbon loss method.
Extended Data Fig. 4 Soil carbon stocks of potential natural vegetation under current climate used to derive COCs with carbon loss method.
Extended Data Fig. 5 Annual net primary productivity of potential native vegetation under current climate used to derive COCs with carbon gain method.
Spoiler Different ways of growing grains :
Extended Data Fig. 1 Carbon benefits of different crop production systems based on the carbon benefits index. I cannot figure this out, is more good or not?
Last edited:
I read this, and it is amazing how bad beef is. I have been rationalising eating beef offal sold as dog food, arguing with myself that meat diverted from the animal food chain is better than that directed at humans, but if it is that bad then I any support for that industry has to be a bad thing:
In a paper in Nature last year, a team led by Timothy Searchinger of Princeton University examined the impact of various foodstuffs in terms of carbon. This shows that protein from beef is 73 times worse than protein from soya.Then I looked at the paper, and some other things surprised me (COC = carbon opportunity cost):
A kilogram of beef protein has the equivalent carbon emissions of a passenger flying from London to New York and back. The overall carbon cost of 1 kilogram of beef protein is equivalent to 1250 kg of CO2. Aircraft emissions for long-haul flights are roughly 110 grams per passenger per kilometre, and the return distance is 11,170 km – so 1229 kg of CO2.
Poultry and pork better that ovo-lacto vegetarian:
Fig. 3: Carbon costs of different diets based on the carbon benefits index.
Petrol better that biofuels (why did the UK government force us to go 10% ethanol?)
Fig. 2: Carbon costs of different fuel sources (per kilometre driven) based on the carbon benefits index.
I do not quite get the difference between these maps, but I am sure they mean we should be protecting the tropical rainforests and the northern tundras
Spoiler Three world maps of soil carbon :
Extended Data Fig. 3 Above- and below-ground carbon stocks of potential natural vegetation under current climate, used to derive COCs with the carbon loss method.
Extended Data Fig. 4 Soil carbon stocks of potential natural vegetation under current climate used to derive COCs with carbon loss method.
Extended Data Fig. 5 Annual net primary productivity of potential native vegetation under current climate used to derive COCs with carbon gain method.
Spoiler Different ways of growing grains :
Extended Data Fig. 1 Carbon benefits of different crop production systems based on the carbon benefits index. I cannot figure this out, is more good or not?
Would be interesting to know what the carbon footprint is of reactor made artificial meat.
Is that a dead alley that sounds nice ?
(animal friendly)
Or is the carbon footprint comparable with soy or pea-bean-lentil based artificial meat.
Whereby noted that, if it would be that animal friendly considerations would be priming the pump to get the R&D scale size and manufacturing scale size to overcome an initial "too high" carbon footprint of artificial meats, I am still happy.
That paper is really anti meat and biofuels:
As these examples * illustrate, our analysis finds that consumption and land use changes (LUCs) can have many times larger implications for climate change than often calculated. By undercounting the carbon storage opportunity costs of land, life cycle assessments (LCAs) and economic models can greatly overvalue mere shifts in land uses—for example, shifting croplands or pasture to forest or bioenergy—and undervalue both increases in pasture or crop productivity and reductions in demand—such as shifts to diets low in beef and milk.
First, our index can be used to evaluate shifts from agriculture to forest or bioenergy. Efforts to deliberately replace food production with forests or bioenergy for climate purposes could require sizable carbon benefits as one core criterion. Regardless of whether price effects alter consumption or the productivity of other farms, the world is unlikely to achieve the ultimate climate goals through LUCs that reduce the global capacity to store carbon. In addition, changing the production of one hectare of land to try to lower GHGs by reducing food consumption is probably inefficient and inequitable, as suggested by the SUV example. Other farmers would probably replace most of the production, and higher prices would typically depress consumption by the poor more than by the rich owing to the greater price-sensitivity of the former. To reduce inefficient consumption, targeted taxes or other demand strategies could be more efficient and equitable.
Second, our index can be used in attributional LCAs to assign land-use carbon costs to consumption choices, as we show in our diet examples. Those LCAs also use average GHG costs of production, rather than some estimate of marginal costs, and similarly assume that one person’s change in consumption equally alters global consumption.
Third, our index can be used as a benchmark for evaluating predictive models. Accurately projecting marginal, rather than average, consequences of one hectare’s changes would still have value. Doing so requires economic models, but results greatly vary by model or assumption. Only a small number of the demand and supply elasticities required by global models have been econometrically estimated. Missing critical estimates include almost all cross-price elasticities, almost all medium-to-long-term elasticities, and supply elasticities of different pasture systems, although pasture occupies two-thirds of all agricultural land (Supplementary Information). Our view is that global land sparing is powerful, although often hidden, because gains in local yields can increase competitiveness and encourage local expansion. Although our index cannot by itself answer these questions, the COC provides a useful benchmark to evaluate model results. For example, California’s estimates of ILUC from maize ethanol are about 10% of the average global loss of carbon generated by producing the required maize (using California’s amortization period and after accounting for by-products). By providing this average cost, our index helps to evaluate a model’s justification for estimating greatly different marginal costs.
Last, where some conversion of natural vegetation to agriculture is inevitable, such as for oil palm in Southeast Asia or for staple foods in Africa, our index could help to determine the most efficient lands and crops to choose. For policy reasons, however, we advise great caution in using the index to justify conversion of native vegetation based on claims of high food yields. Because climate strategies require quick elimination of emissions from LUCs, clearing land in one location does not provide a general solution, even if clearing elsewhere would be worse. Strategies to reduce LUCs require strong policies to discourage expansion, so farmers intensify instead. It may be tempting to exaggerate likely yields on lands proposed for conversion, and promises of intensive management cannot justify conversions if the same investment could generate equal yields on existing cropland. However, these kinds of conversion also have high potential to harm biodiversity and other ecosystem values, which our index does not measure and which must be evaluated separately.
Spoiler * The Examples :
First, we consider production changes from Brazil grazing land. In Brazil, because of low yields of beef from extensive cattle grazing, proposals exist either to convert pastures to cropland for soybeans or to sugarcane for ethanol, or to intensify pasture management to help meet the expected increases of about 80% in global beef demand by 2050. We consider which changes would produce more carbon benefits. Cardoso et al. categorized beef production in the Cerrado region in Brazil into five systems with increasing beef yields from 30 kg ha−1 yr−1 to 220 kg ha−1 yr−1 on the basis of grazing practices, healthcare, fertilization and replanting frequency, and uses of legumes or crop supplements. We find that for grazing land using system 1 (30 kg ha−1 yr−1, carcass weight) shifting to sugarcane ethanol increases carbon benefits (Fig. 1). However, the more commonly used system 2 (75 kg ha−1 yr−1) generates roughly the same benefits as sugarcane ethanol, whereas system 3 (150 kg ha−1 yr−1) produces much greater carbon benefits. Shifting to soybean production at average Brazilian yields would produce more benefits than grazing system 2, but less than system 3.
By contrast, reforesting pastures at 5 t C ha−1 yr−1 would increase carbon benefits by a factor of five in the Atlantic Coastal Rainforest region. Grazing system 1 is mostly used in this region at present and pastures are difficult to intensify because they are mainly located on steep terrain.
Factoring in the land’s COCs, we find that shifting from system 1 to system 3 increases benefits six times, in contrast to the merely twofold gain from PEMs only. Shifting from grazing system 2 to system 3 provides annual benefits equivalent to those of temperate forest growth (about 3 t C ha−1 yr−1)18,19. Extensive systems that use arid, native grasslands, including nomadic systems, can still be efficient despite producing little beef and few carbon benefits because they also sacrifice little opportunity to store carbon (Supplementary Information).
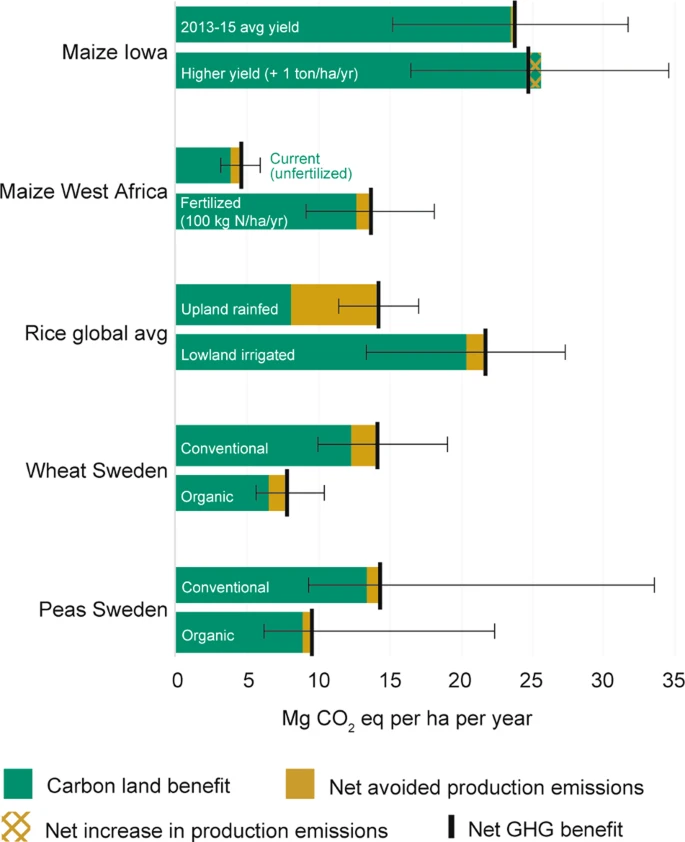
Second, we consider production changes related to intensification. By examining several plausible examples, we find that increasing crop inputs usually saves more GHGs through reduced land demands than the increase in GHGs because of higher PEMs. Examples include adding 75 kg ha−1 yr−1 of nitrogen to maize in West Africa using flooded, irrigated rice, rather than upland rice, despite its higher methane emission, and comparing conventional versus organic bean production in Sweden (Extended Data Fig. 1).
Third, we consider production changes related to biofuel production. Carbon benefits from cropland with a rotation of maize and soybeans at average Iowa yields (22 t CO2e ha−1 yr−1) greatly exceed those of ethanol production either from maize (9 t CO2e ha−1 yr−1) or from perennial grasses (17.5 t CO2e ha−1 yr−1) (assuming optimistic grass dry-matter yields20 of 17 t ha−1 yr−1 and 0.6 t C ha−1 yr−1 soil carbon sequestration; Extended Data Fig. 2). For maize ethanol, feed by-products provide two-thirds of the benefits. Perennial grasses for ethanol would have to achieve implausibly high dry-matter yields of 32 t ha−1 yr−1 to match the benefits of maize–soybean rotations. Fourth, we consider consumption changes related to biofuels. We estimate that the total GHG costs of consuming biofuels, rather than gasoline or diesel, range from 35% more for sugarcane ethanol to 230% more for soybean biodiesel (Fig. 2). Using Central European solar power to run battery electric vehicles generates only 9% of the GHGs of sugarcane ethanol, mostly through battery production (Supplementary Information). Our biofuel COC estimates are equivalent to ILUC estimates if crops diverted to biofuels (after deducting by-products) are fully replaced at the average global carbon loss per kilogram of crop. Our estimates range from 100 g MJ−1 to 300 g MJ−1 of CO2 emissions for biofuels from different feedstocks—higher than gasoline or diesel emissions, even without counting their PEMs (Extended Data Table 3). Our estimates are mostly 6–14 times higher than those of economic models commissioned by California and the European Commission (Supplementary Table 4).
Last, we consider consumption changes related to shifting diets. LCAs have long estimated GHG benefits from diet shifts away from ruminant products (box 8 in ref. 12), but typically assign little or no GHG costs to land requirements. By applying the carbon benefits index, we find global-average GHG costs of dairy and beef about 3–4 times higher than previous estimates by the UN Food and Agriculture Organization8 (Supplementary Information), which only include land-use GHGs from each year’s agricultural expansion. We estimate the total GHG costs of average Northern European diets22 at more than 9 t CO2 yr−1 per capita (Fig. 3). That is about 20 times the most-emitting diet estimate in Tilman and Clark4 and equivalent to GHGs typically assigned to each European’s consumption of all goods, including energy23. Shifting from beef and dairy would reduce those emissions by 70%. Although animal products offer health benefits for the food-insecure, we estimate much larger climate benefits than others if the wealthy consume less beef and dairy.
By contrast, reforesting pastures at 5 t C ha−1 yr−1 would increase carbon benefits by a factor of five in the Atlantic Coastal Rainforest region. Grazing system 1 is mostly used in this region at present and pastures are difficult to intensify because they are mainly located on steep terrain.
Factoring in the land’s COCs, we find that shifting from system 1 to system 3 increases benefits six times, in contrast to the merely twofold gain from PEMs only. Shifting from grazing system 2 to system 3 provides annual benefits equivalent to those of temperate forest growth (about 3 t C ha−1 yr−1)18,19. Extensive systems that use arid, native grasslands, including nomadic systems, can still be efficient despite producing little beef and few carbon benefits because they also sacrifice little opportunity to store carbon (Supplementary Information).
Second, we consider production changes related to intensification. By examining several plausible examples, we find that increasing crop inputs usually saves more GHGs through reduced land demands than the increase in GHGs because of higher PEMs. Examples include adding 75 kg ha−1 yr−1 of nitrogen to maize in West Africa using flooded, irrigated rice, rather than upland rice, despite its higher methane emission, and comparing conventional versus organic bean production in Sweden (Extended Data Fig. 1).
Third, we consider production changes related to biofuel production. Carbon benefits from cropland with a rotation of maize and soybeans at average Iowa yields (22 t CO2e ha−1 yr−1) greatly exceed those of ethanol production either from maize (9 t CO2e ha−1 yr−1) or from perennial grasses (17.5 t CO2e ha−1 yr−1) (assuming optimistic grass dry-matter yields20 of 17 t ha−1 yr−1 and 0.6 t C ha−1 yr−1 soil carbon sequestration; Extended Data Fig. 2). For maize ethanol, feed by-products provide two-thirds of the benefits. Perennial grasses for ethanol would have to achieve implausibly high dry-matter yields of 32 t ha−1 yr−1 to match the benefits of maize–soybean rotations. Fourth, we consider consumption changes related to biofuels. We estimate that the total GHG costs of consuming biofuels, rather than gasoline or diesel, range from 35% more for sugarcane ethanol to 230% more for soybean biodiesel (Fig. 2). Using Central European solar power to run battery electric vehicles generates only 9% of the GHGs of sugarcane ethanol, mostly through battery production (Supplementary Information). Our biofuel COC estimates are equivalent to ILUC estimates if crops diverted to biofuels (after deducting by-products) are fully replaced at the average global carbon loss per kilogram of crop. Our estimates range from 100 g MJ−1 to 300 g MJ−1 of CO2 emissions for biofuels from different feedstocks—higher than gasoline or diesel emissions, even without counting their PEMs (Extended Data Table 3). Our estimates are mostly 6–14 times higher than those of economic models commissioned by California and the European Commission (Supplementary Table 4).
Last, we consider consumption changes related to shifting diets. LCAs have long estimated GHG benefits from diet shifts away from ruminant products (box 8 in ref. 12), but typically assign little or no GHG costs to land requirements. By applying the carbon benefits index, we find global-average GHG costs of dairy and beef about 3–4 times higher than previous estimates by the UN Food and Agriculture Organization8 (Supplementary Information), which only include land-use GHGs from each year’s agricultural expansion. We estimate the total GHG costs of average Northern European diets22 at more than 9 t CO2 yr−1 per capita (Fig. 3). That is about 20 times the most-emitting diet estimate in Tilman and Clark4 and equivalent to GHGs typically assigned to each European’s consumption of all goods, including energy23. Shifting from beef and dairy would reduce those emissions by 70%. Although animal products offer health benefits for the food-insecure, we estimate much larger climate benefits than others if the wealthy consume less beef and dairy.
Well, quick google later:Would be interesting to know what the carbon footprint is of reactor made artificial meat.
Is that a dead alley that sounds nice ?
(animal friendly)
Or is the carbon footprint comparable with soy or pea-bean-lentil based artificial meat.
Whereby noted that, if it would be that animal friendly considerations would be priming the pump to get the R&D scale size and manufacturing scale size to overcome an initial "too high" carbon footprint of artificial meats, I am still happy.
We conclude that cultured meat is not prima facie climatically superior to cattle; its relative impact instead depends on the availability of decarbonized energy generation and the specific production systems that are realized.
Longer version:
We compare the temperature impact of beef cattle and cultured meat production at all times to 1,000 years in the future, using four synthetic meat GHG footprints currently available in the literature and three different beef production systems studied in an earlier climate modeling paper. Cattle systems are associated with the production of all three GHGs above, including significant emissions of CH4, while cultured meat emissions are almost entirely CO2 from energy generation. Under continuous high global consumption, cultured meat results in less warming than cattle initially, but this gap narrows in the long term and in some cases cattle production causes far less warming, as CH4 emissions do not accumulate, unlike CO2.
We then model a decline in meat consumption to more sustainable levels following high consumption, and show that although cattle systems generally result in greater peak warming than cultured meat, the warming effect declines and stabilizes under the new emission rates of cattle systems, while the CO2 based warming from cultured meat persists and accumulates even under reduced consumption, again overtaking cattle production in some scenarios.
How they grow the meat:We then model a decline in meat consumption to more sustainable levels following high consumption, and show that although cattle systems generally result in greater peak warming than cultured meat, the warming effect declines and stabilizes under the new emission rates of cattle systems, while the CO2 based warming from cultured meat persists and accumulates even under reduced consumption, again overtaking cattle production in some scenarios.
The first cultured meat LCA study, presented in Tuomisto and Teixeira de Mattos (2011), hypothesized a system in which animal embryonic stem cells are grown in a cylindrical stirred tank bioreactor in a medium of cyanobacteria hydrolysate (as the main “feed” input), vitamins and animal growth factors. Animal growth factors are produced from genetically engineered Escherichia coli, and both growth factors and vitamins are considered to be required in negligible volumes, and hence incur negligible environmental impacts (including GHG emissions). The cyanobacteria production is assumed to take place in an open pond, with some synthetic nitrogen use considered in the default case, but either nitrogen-fixing cyanobacteria or “nutrient-rich wastewater” used to eliminate the need for fertilizer inputs in the most optimistic scenarios. Greenhouse gas emissions result primarily from energy use and transport in growing and moving the cyanobacteria to the site of cultured meat production, followed by energy use in cyanobacteria processing and stirring the cell culture tank for 60 days.
The second cultured meat footprint used in this study was obtained from Tuomisto et al. (2014). The hypothesized systems are largely as described above from Tuomisto and Teixeira de Mattos (2011), but with some refinements made to the assumed operation of the bioreactor, and a number of plant-based alternative feedstocks considered in addition to cyanobacteria.
The remaining two cultured meat footprints were both taken from Mattick et al. (2015b). In this study, a two-step culturing process is assumed: after 5 days of proliferation of muscle stem cells, the bioreactor is drained and filled with a different medium for 72 h of cell differentiation and mass gain. It is assumed that the main constituents of the culture media are peptides and amino acids from soy hydrolysis, glucose from corn starch, and again a negligible volume of growth factors. In contrast to the more speculative approach of the two papers above, this study bases its assumptions on the metabolic requirements and yields of cultured meat on data from Chinese Hamster Ovary (CHO) cell proliferation (Sung et al., 2004), as a previously tested analog for cell culture conditions. Corn starch microcarrier beads provide a scaffold around which cells proliferate, and the process is assumed to take place within stirred-tank bioreactors.
Estimates:The second cultured meat footprint used in this study was obtained from Tuomisto et al. (2014). The hypothesized systems are largely as described above from Tuomisto and Teixeira de Mattos (2011), but with some refinements made to the assumed operation of the bioreactor, and a number of plant-based alternative feedstocks considered in addition to cyanobacteria.
The remaining two cultured meat footprints were both taken from Mattick et al. (2015b). In this study, a two-step culturing process is assumed: after 5 days of proliferation of muscle stem cells, the bioreactor is drained and filled with a different medium for 72 h of cell differentiation and mass gain. It is assumed that the main constituents of the culture media are peptides and amino acids from soy hydrolysis, glucose from corn starch, and again a negligible volume of growth factors. In contrast to the more speculative approach of the two papers above, this study bases its assumptions on the metabolic requirements and yields of cultured meat on data from Chinese Hamster Ovary (CHO) cell proliferation (Sung et al., 2004), as a previously tested analog for cell culture conditions. Corn starch microcarrier beads provide a scaffold around which cells proliferate, and the process is assumed to take place within stirred-tank bioreactors.
Study 1: 1.69 - 2.01 kg CO2e per kg cultured meat
Study 2: 3.67 kg CO2e per kg cultured meat
Study 3+4 (?): 7.5 kg CO2e per kg cultured meat
That paper is really anti meat and biofuels:
As these examples * illustrate, our analysis finds that consumption and land use changes (LUCs) can have many times larger implications for climate change than often calculated. By undercounting the carbon storage opportunity costs of land, life cycle assessments (LCAs) and economic models can greatly overvalue mere shifts in land uses—for example, shifting croplands or pasture to forest or bioenergy—and undervalue both increases in pasture or crop productivity and reductions in demand—such as shifts to diets low in beef and milk.
First, our index can be used to evaluate shifts from agriculture to forest or bioenergy. Efforts to deliberately replace food production with forests or bioenergy for climate purposes could require sizable carbon benefits as one core criterion. Regardless of whether price effects alter consumption or the productivity of other farms, the world is unlikely to achieve the ultimate climate goals through LUCs that reduce the global capacity to store carbon. In addition, changing the production of one hectare of land to try to lower GHGs by reducing food consumption is probably inefficient and inequitable, as suggested by the SUV example. Other farmers would probably replace most of the production, and higher prices would typically depress consumption by the poor more than by the rich owing to the greater price-sensitivity of the former. To reduce inefficient consumption, targeted taxes or other demand strategies could be more efficient and equitable.
Second, our index can be used in attributional LCAs to assign land-use carbon costs to consumption choices, as we show in our diet examples. Those LCAs also use average GHG costs of production, rather than some estimate of marginal costs, and similarly assume that one person’s change in consumption equally alters global consumption.
Third, our index can be used as a benchmark for evaluating predictive models. Accurately projecting marginal, rather than average, consequences of one hectare’s changes would still have value. Doing so requires economic models, but results greatly vary by model or assumption. Only a small number of the demand and supply elasticities required by global models have been econometrically estimated. Missing critical estimates include almost all cross-price elasticities, almost all medium-to-long-term elasticities, and supply elasticities of different pasture systems, although pasture occupies two-thirds of all agricultural land (Supplementary Information). Our view is that global land sparing is powerful, although often hidden, because gains in local yields can increase competitiveness and encourage local expansion. Although our index cannot by itself answer these questions, the COC provides a useful benchmark to evaluate model results. For example, California’s estimates of ILUC from maize ethanol are about 10% of the average global loss of carbon generated by producing the required maize (using California’s amortization period and after accounting for by-products). By providing this average cost, our index helps to evaluate a model’s justification for estimating greatly different marginal costs.
Last, where some conversion of natural vegetation to agriculture is inevitable, such as for oil palm in Southeast Asia or for staple foods in Africa, our index could help to determine the most efficient lands and crops to choose. For policy reasons, however, we advise great caution in using the index to justify conversion of native vegetation based on claims of high food yields. Because climate strategies require quick elimination of emissions from LUCs, clearing land in one location does not provide a general solution, even if clearing elsewhere would be worse. Strategies to reduce LUCs require strong policies to discourage expansion, so farmers intensify instead. It may be tempting to exaggerate likely yields on lands proposed for conversion, and promises of intensive management cannot justify conversions if the same investment could generate equal yields on existing cropland. However, these kinds of conversion also have high potential to harm biodiversity and other ecosystem values, which our index does not measure and which must be evaluated separately.
Spoiler * The Examples :First, we consider production changes from Brazil grazing land. In Brazil, because of low yields of beef from extensive cattle grazing, proposals exist either to convert pastures to cropland for soybeans or to sugarcane for ethanol, or to intensify pasture management to help meet the expected increases of about 80% in global beef demand by 2050. We consider which changes would produce more carbon benefits. Cardoso et al. categorized beef production in the Cerrado region in Brazil into five systems with increasing beef yields from 30 kg ha−1 yr−1 to 220 kg ha−1 yr−1 on the basis of grazing practices, healthcare, fertilization and replanting frequency, and uses of legumes or crop supplements. We find that for grazing land using system 1 (30 kg ha−1 yr−1, carcass weight) shifting to sugarcane ethanol increases carbon benefits (Fig. 1). However, the more commonly used system 2 (75 kg ha−1 yr−1) generates roughly the same benefits as sugarcane ethanol, whereas system 3 (150 kg ha−1 yr−1) produces much greater carbon benefits. Shifting to soybean production at average Brazilian yields would produce more benefits than grazing system 2, but less than system 3.
By contrast, reforesting pastures at 5 t C ha−1 yr−1 would increase carbon benefits by a factor of five in the Atlantic Coastal Rainforest region. Grazing system 1 is mostly used in this region at present and pastures are difficult to intensify because they are mainly located on steep terrain.
Factoring in the land’s COCs, we find that shifting from system 1 to system 3 increases benefits six times, in contrast to the merely twofold gain from PEMs only. Shifting from grazing system 2 to system 3 provides annual benefits equivalent to those of temperate forest growth (about 3 t C ha−1 yr−1)18,19. Extensive systems that use arid, native grasslands, including nomadic systems, can still be efficient despite producing little beef and few carbon benefits because they also sacrifice little opportunity to store carbon (Supplementary Information).
Second, we consider production changes related to intensification. By examining several plausible examples, we find that increasing crop inputs usually saves more GHGs through reduced land demands than the increase in GHGs because of higher PEMs. Examples include adding 75 kg ha−1 yr−1 of nitrogen to maize in West Africa using flooded, irrigated rice, rather than upland rice, despite its higher methane emission, and comparing conventional versus organic bean production in Sweden (Extended Data Fig. 1).
Third, we consider production changes related to biofuel production. Carbon benefits from cropland with a rotation of maize and soybeans at average Iowa yields (22 t CO2e ha−1 yr−1) greatly exceed those of ethanol production either from maize (9 t CO2e ha−1 yr−1) or from perennial grasses (17.5 t CO2e ha−1 yr−1) (assuming optimistic grass dry-matter yields20 of 17 t ha−1 yr−1 and 0.6 t C ha−1 yr−1 soil carbon sequestration; Extended Data Fig. 2). For maize ethanol, feed by-products provide two-thirds of the benefits. Perennial grasses for ethanol would have to achieve implausibly high dry-matter yields of 32 t ha−1 yr−1 to match the benefits of maize–soybean rotations. Fourth, we consider consumption changes related to biofuels. We estimate that the total GHG costs of consuming biofuels, rather than gasoline or diesel, range from 35% more for sugarcane ethanol to 230% more for soybean biodiesel (Fig. 2). Using Central European solar power to run battery electric vehicles generates only 9% of the GHGs of sugarcane ethanol, mostly through battery production (Supplementary Information). Our biofuel COC estimates are equivalent to ILUC estimates if crops diverted to biofuels (after deducting by-products) are fully replaced at the average global carbon loss per kilogram of crop. Our estimates range from 100 g MJ−1 to 300 g MJ−1 of CO2 emissions for biofuels from different feedstocks—higher than gasoline or diesel emissions, even without counting their PEMs (Extended Data Table 3). Our estimates are mostly 6–14 times higher than those of economic models commissioned by California and the European Commission (Supplementary Table 4).
Last, we consider consumption changes related to shifting diets. LCAs have long estimated GHG benefits from diet shifts away from ruminant products (box 8 in ref. 12), but typically assign little or no GHG costs to land requirements. By applying the carbon benefits index, we find global-average GHG costs of dairy and beef about 3–4 times higher than previous estimates by the UN Food and Agriculture Organization8 (Supplementary Information), which only include land-use GHGs from each year’s agricultural expansion. We estimate the total GHG costs of average Northern European diets22 at more than 9 t CO2 yr−1 per capita (Fig. 3). That is about 20 times the most-emitting diet estimate in Tilman and Clark4 and equivalent to GHGs typically assigned to each European’s consumption of all goods, including energy23. Shifting from beef and dairy would reduce those emissions by 70%. Although animal products offer health benefits for the food-insecure, we estimate much larger climate benefits than others if the wealthy consume less beef and dairy.
Because we slept for some decades we are now in a hurry with the risk of investing and changing hugely in projects that can turn out in the future, after progressive insights to be flawed.
Decades wasted that should have been used for targetted projects of big enough scale size, big enough diversity in testing circumstances AND long enough duration.
We will never get fullproof but we do need "good enough" evidence if reversing has high hurdles.
And considering the significant means that need to be deployed and the vey clear changes in daily life for everybody, even now the perceptional effects on the broad expert communities and broad masses will influence which choices decisionmakers (among the good intending for governing people) will make. For sure not the best technocratic choices. Politics is also a compromise with the perceptional and intuitional bias of the broad masses.
Natural Bio BTW a very inefficient way to convert sunlight into fuel-energy.
Max leaf efficiency approx 5%, but the overall efficiency (incl the energy cost of the plant and roots, the building and maintenance) is 0.1% - 1.0%
https://en.wikipedia.org/wiki/Photosynthetic_efficiency
Last edited:
The overall carbon cost of 1 kilogram of beef protein is equivalent to 1250 kg of CO2.
1 kilo meat is approx 200 gram protein
=> you need 5 kilo meat for 1 kilo protein
=> per kilo meat you get 1250/5 = 250 kg CO2
Study 1: 1.69 - 2.01 kg CO2e per kg cultured meat
Study 2: 3.67 kg CO2e per kg cultured meat
Study 3+4 (?): 7.5 kg CO2e per kg cultured meat
Cultured meat between 1.69 and 7.5 kilo CO2 per kilo meat.
That's a very big difference in favor of cultured meat.
Do I misread, misunderstand something ?
Even if dry weight meat and meat are confused... that is only a factor 5. This diff is bigger.
I have only skimmed the papers. That looks like a massive discrepancy, that may have more to do with the question than the answer. The first paper is basically saying we are undercounting the cost of land use changes happening now or predicted in the near future. The second paper is trying to model the next thousand years given than we live that long. I did not read about their predictions for beef productions on those timescales, but they could justifiably much better than we are doing now.1 kilo meat is approx 200 gram protein
=> you need 5 kilo meat for 1 kilo protein
=> per kilo meat you get 1250/5 = 250 kg CO2
Cultured meat between 1.69 and 7.5 kilo CO2 per kilo meat.
That's a very big difference in favor of cultured meat.
Do I misread, misunderstand something ?
Even if dry weight meat and meat are confused... that is only a factor 5. This diff is bigger.
Thwaites Glacier is fracturing and "retreating rapidly"
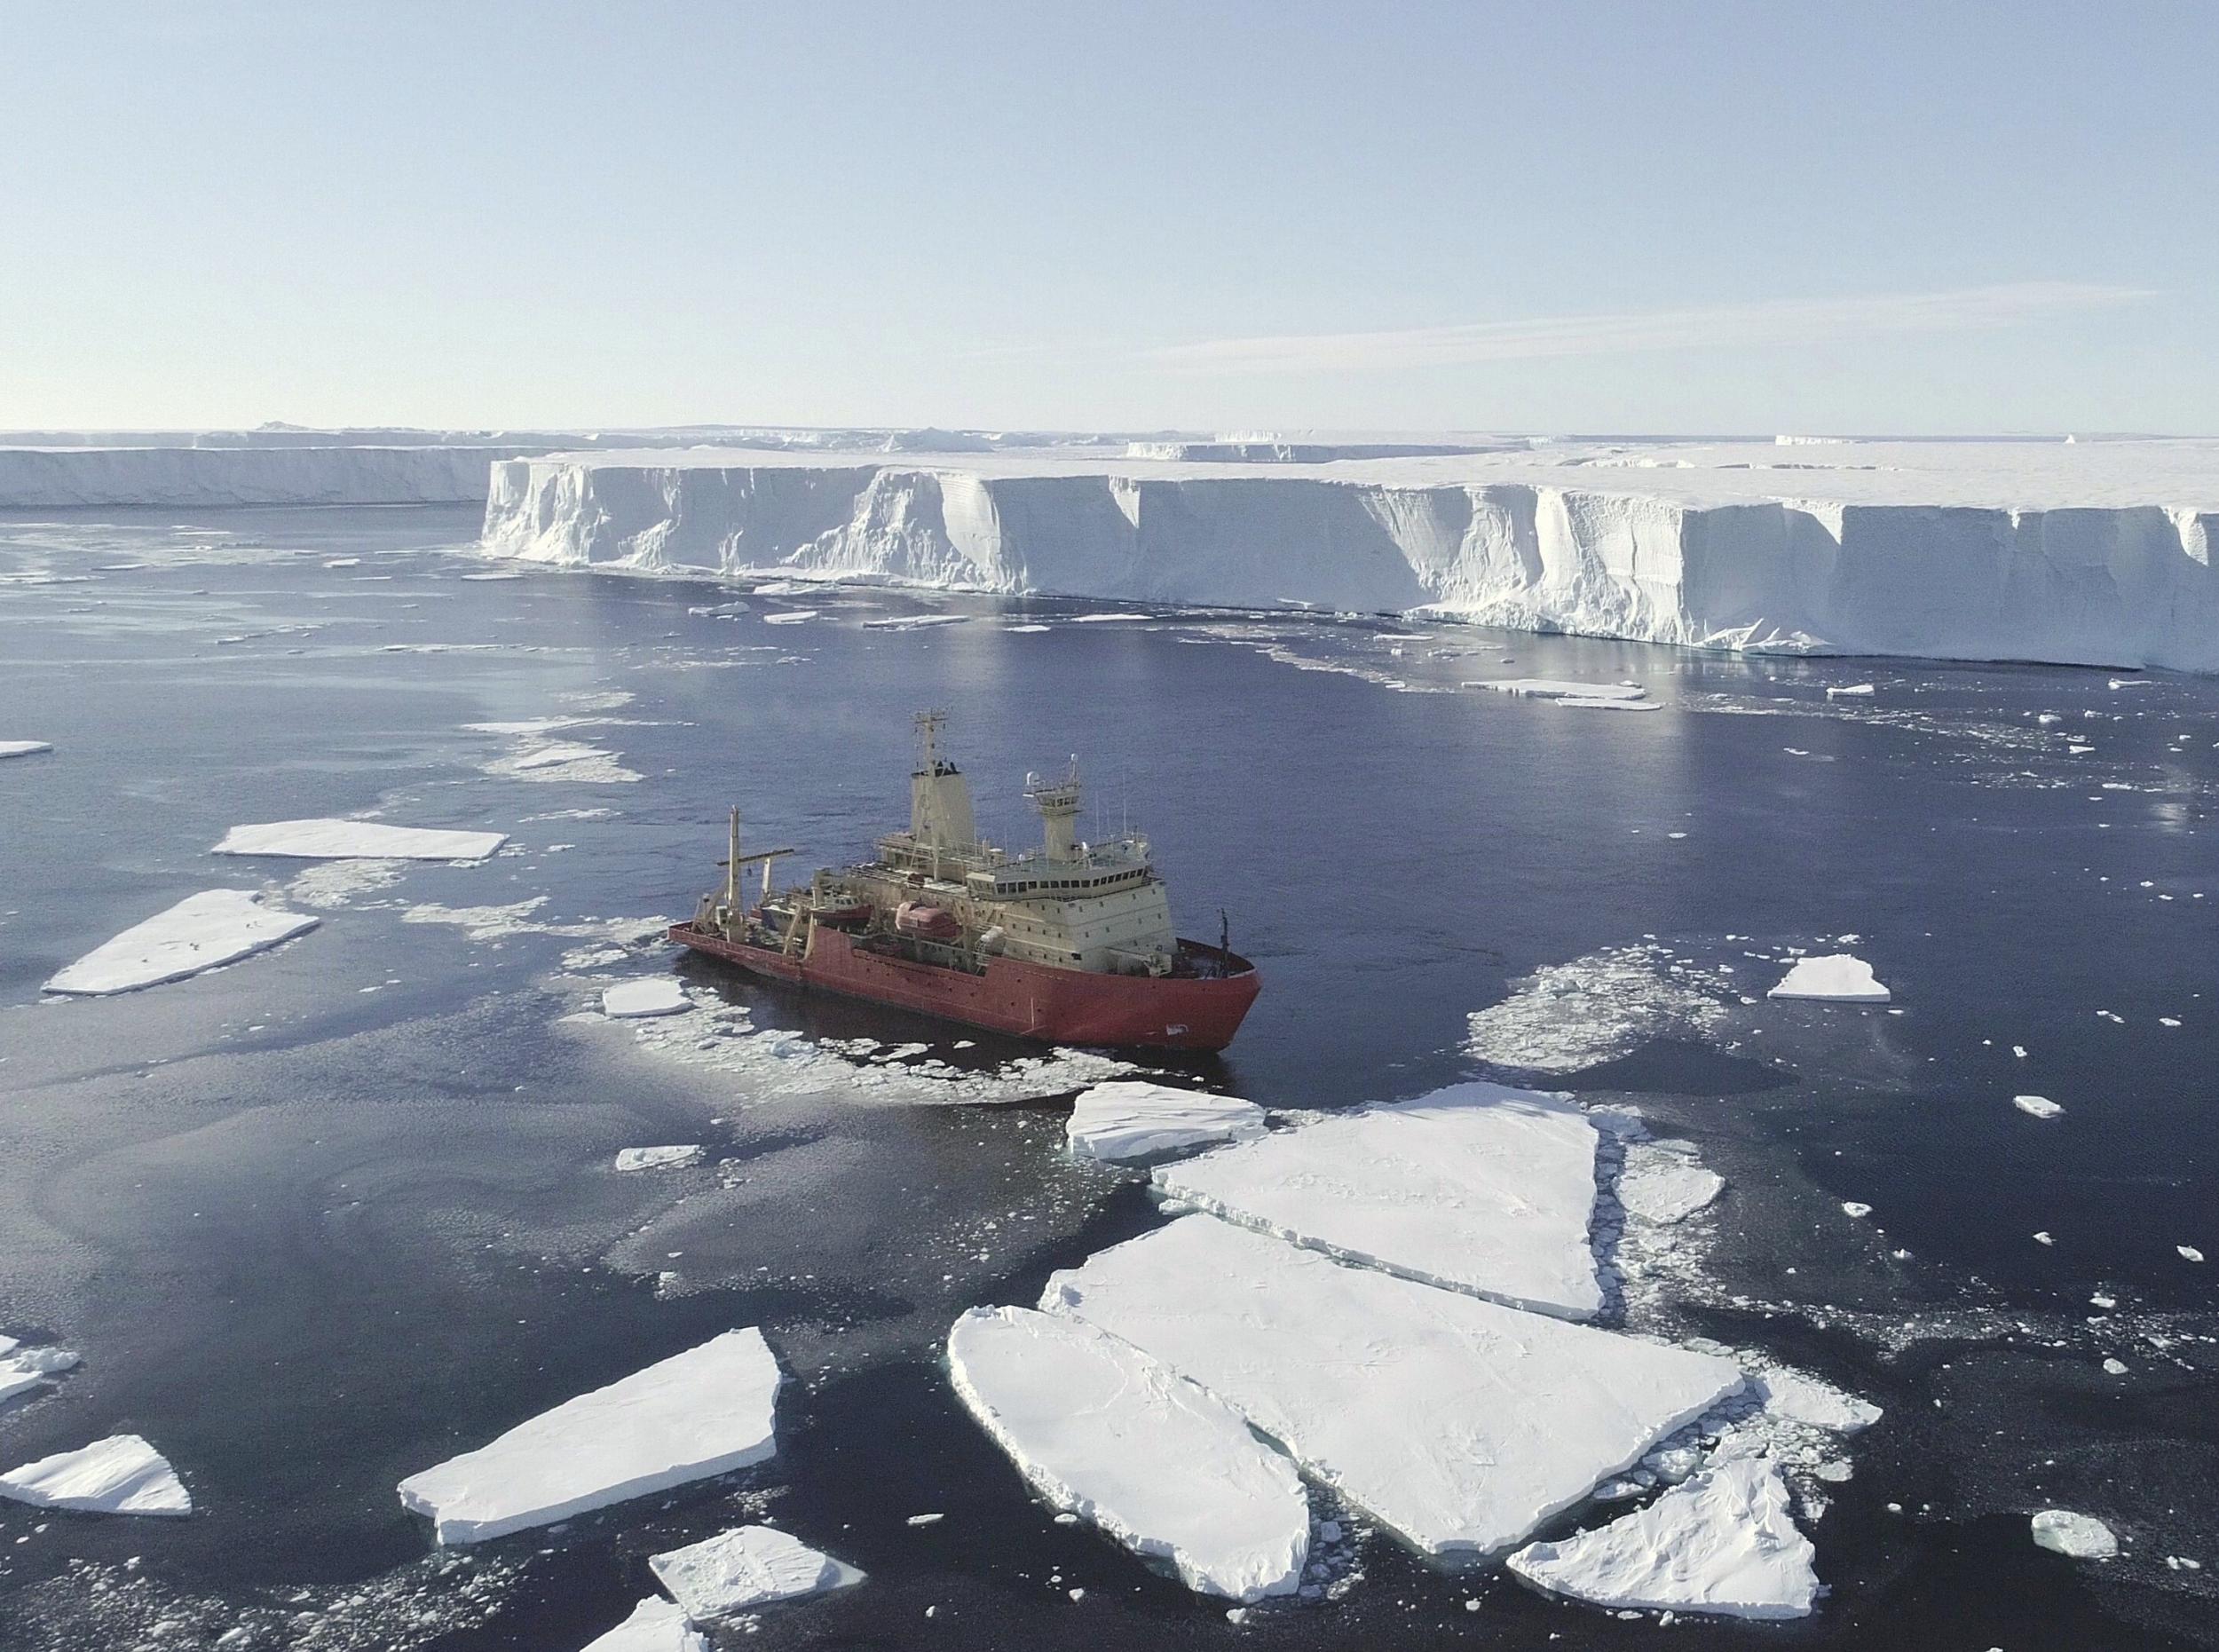
Ice shelf holding back Antarctica’s ‘Doomsday glacier’, is fracturing and ‘won’t last long’, scientists warn
The glacier, which flows into the Amundsen sea off western Antarctica, is around the size of Britain, or Florida, and its melting already contributes four per cent to annual global sea level rises.
Scientists have said it is now at serious risk of collapse, suggesting it could last "just a few more years" as the warming ocean waters are slowly erasing the glacier’s ice from below, leading to greater levels of fracturing and a faster flow of ice into the Southern Ocean.
“It’s doubled its outflow speed within the last 30 years, and the glacier in its entirety holds enough water to raise sea level by over two feet. And it could lead to even more sea-level rise, up to 10 feet, if it draws the surrounding glaciers with it.”
Thwaites stretches across a 120km length of frozen coastline. On its eastern side, the ice flows more slowly than the rest. This area is braced by a floating ice shelf, which thrusts out from the land mass, and remains held in place by an underwater mountain.
But the ice shelf "won’t last for long", according to Erin Petitt, an associate professor at Oregon State University.
Warmer ocean water circulating beneath the ice shelf is attacking the glacier from all angles, her team has found.
This water is melting the ice directly from beneath, and as it does so, the glacier loses its grip on the underwater mountain. Massive factures have formed and are growing as well, accelerating its demise, said Pettit. This floating extension of the Thwaites Glacier will likely survive only a few more years.
A challenge for the team is assessing if, when, and how fast this might occur, but major ice loss is possible within several decades to a few centuries.
‘Drastic’ rise in high Arctic lightning has scientists worried

The high Arctic saw a dramatic rise in lightning in 2021 in what could be one of the most spectacular manifestations of the climate crisis.
In a region where sightings were once rare, the Earth’s northernmost region saw 7,278 lightning strikes in 2021 – nearly double as many as the previous nine years combined.
Arctic air typically lacks the convective heat required to create lightning so the latest findings, published in the Finnish firm Vaisala’s annual lightning report, have scientists like Vaisala’s meteorologist and lightning applications manager, Chris Vagasky, worried.
“Over the last 10 years, overall lightning counts north of the Arctic Circle have been fairly consistent,” Vagasky said. “But at the highest latitudes of the planet – north of 80° – the increase has been drastic. Such a significant shift certainly causes you to raise your eyebrows.”
Three things are required to generate thunderstorms – moisture, instability and lift. The disappearance of sea ice means more water is able to evaporate, adding moisture to the atmosphere. Higher temperatures and atmospheric instability create the perfect conditions for lightning. Monitoring how lightning trends change in the Arctic can therefore reveal a lot about how the atmosphere is changing in response to shifts in climate.
EnglishEdward
Deity
Ice shelf holding back Antarctica’s ‘Doomsday glacier’, is fracturing and ‘won’t last long’, scientists warn
It’s doubled its outflow speed within the last 30 years, and the glacier in its entirety holds enough water to raise sea level by over two feet. And it could lead to even more sea-level rise, up to 10 feet, if it draws the surrounding glaciers with it.
Consequence being homeless penguins I suppose, and my house goes under the water.
....The high Arctic saw a dramatic rise in lightning in 2021 in what could be one of the most spectacular manifestations of the climate crisis.....
So what are the adverse consequences, more polar bears dying of lightning strikes?
From the article, they only talked about the people in those areas having to live with more lightening, which because of the relatively featureless terrian is somewhat more of a risk than it is other places. I got the impression it is more about this being an indicator of the changing climate that directly a problem in itself.So what are the adverse consequences, more polar bears dying of lightning strikes?
Similar threads
- Replies
- 12
- Views
- 2K
- Replies
- 328
- Views
- 26K
- Replies
- 7
- Views
- 687
- Replies
- 12
- Views
- 1K