Climate Change Anecdotes

Yeah. Here in the UK we just had a whole week of 30+C. Which doesn't happen in September (hell, we often don't get it at the height of summer).

Normally hits 30 a few days here but in UK that should be an exceptionally hot summer day height of summer.
.
 
Swallows are a seasonal bird - coming to Europe for summer and returning to Africa for our winter.

It seems some have been spotted staying over the winter in the warmer, less exposed parts of Ireland (the south east)
 
Swallows are a seasonal bird - coming to Europe for summer and returning to Africa for our winter.

It seems some have been spotted staying over the winter in the warmer, less exposed parts of Ireland (the south east)
Has there been any comment about where they have over wintered in the past?
 
Another day, another "Carbon credits are fantasy" report
  • A total of 39 of the top 50 emission offset projects, or 78% of them, were categorised as likely junk or worthless due to one or more fundamental failing that undermines its promised emission cuts.
  • Eight others (16%) look problematic, with evidence suggesting they may have at least one fundamental failing and are potentially junk, according to the classification system applied.
  • The efficacy of the remaining three projects (6%) could not be determined definitively as there was insufficient public, independent information to adequately assess the quality of the credits and/or accuracy of their claimed climate benefits.
  • Overall, $1.16bn (£937m) of carbon credits have been traded so far from the projects classified by the investigation as likely junk or worthless; a further $400m of credits bought and sold were potentially junk
 
Last edited:
Antarctic sea ice hits ‘record-smashing’ low coverage area, new data show

Sea ice that covers the ocean around Antarctica hit a record low surface area in the winter, a preliminary analysis of US satellite data shows, and scientists fear the impact of climate change is increasing at the southern pole.

As the southern hemisphere transitions into spring, Antarctic sea ice had reached only a maximum size of 16.96 million sq km (6.55 million sq miles) by September 10, the US space agency, NASA, and the National Snow and Ice Data Center (NSIDC) said on Monday.

jHQdxA2.png
Posts like this are exactly why I miss more post reactions. There's no way in heck I "like" this, but also quoting it seems superfluous. Giving it a go this once though, because, yikes.
 
India receives lowest rains in 5 years, agricultural production to be hit

India’s monsoon rainfall this year was its lowest since 2018 as the El Nino weather pattern made August the driest in more than a century, the state-run weather department said on Saturday, which is likely to affect agricultural production.

The monsoon, which is vital for India’s $3 trillion economy, contributes more than 70 percent of the rain the country needs to water crops and replenish reservoirs and aquifers.

Nearly half of the farmland in the world’s most populous nation lacks irrigation, making the monsoon rains even more vital for agricultural production.

Lower production could prompt India, the world’s second-biggest producer of rice, wheat, and sugar, to impose more curbs on exports of these commodities amid soaring global food prices.

Rainfall over the country from June to September was 94 percent of its long-period average, the lowest since 2018, the India Meteorological Department (IMD) said in a statement.

The IMD had anticipated a rainfall deficit of 4 percent for the season, assuming limited impact from El Nino.

The monsoon was uneven, with June rains nine percent below average because of the delay in the arrival of rains, but July rains rebounded to 13 percent above average.

August was the driest on record with a 36 percent deficit, but again in September rainfall revived and the country received 13 percent more rainfall than normal, the IMD said.

The erratic distribution of monsoon rains has led India, the world’s largest rice exporter, to limit rice shipments, impose a 40 percent duty on onion exports, permit duty-free imports of pulses, and could potentially result in New Delhi banning sugar exports.
 
Posts like this are exactly why I miss more post reactions. There's no way in heck I "like" this, but also quoting it seems superfluous. Giving it a go this once though, because, yikes.

There's another extreme there, I am sure you've seen it over at discord. I have respect for CFC's anti-weaponising approach. Go figure whether I like you, your post or just pinging you, saying Hello, old friend. Comforting ambiguity. :)

Having said that, I wouldn't mind "thanks for the info" button.
To butcher the phrase, one person's comfort is another's anxiety :D
 
More options would be nice.
 
We can even see climate change in daily rainfall patterns

Anthropogenic fingerprints in daily precipitation revealed by deep learning

According to twenty-first century climate-model projections, greenhouse warming will intensify rainfall variability and extremes across the globe. However, verifying this prediction using observations has remained a substantial challenge owing to large natural rainfall fluctuations at regional scales. Here we show that deep learning successfully detects the emerging climate-change signals in daily precipitation fields during the observed record. We trained a convolutional neural network (CNN) with daily precipitation fields and annual global mean surface air temperature data obtained from an ensemble of present-day and future climate-model simulations. After applying the algorithm to the observational record, we found that the daily precipitation data represented an excellent predictor for the observed planetary warming, as they showed a clear deviation from natural variability since the mid-2010s. Furthermore, we analysed the deep-learning model with an explainable framework and observed that the precipitation variability of the weather timescale (period less than 10 days) over the tropical eastern Pacific and mid-latitude storm-track regions was most sensitive to anthropogenic warming. Our results highlight that, although the long-term shifts in annual mean precipitation remain indiscernible from the natural background variability, the impact of global warming on daily hydrological fluctuations has already emerged.

qIOLsCu.png

Spoiler Legend :
a, Time series of the observed AGMT anomaly from 1980 to 2020 (black line) and the annual average of the estimated AGMT obtained by using daily precipitation fields from the MSWEP (blue line), IMERG (purple line) and GPCP (orange line) observations and ERA5 reanalysis (red line) as inputs in the DD model, whose temporal correlation with the observed AGMT is 0.74, 0.80, 0.76 and 0.85 during 2001–2020, respectively. The corresponding coloured dots denote the daily estimated AGMT using the MSWEP and ERA5 precipitation data. The dashed black horizontal lines denote a 95% confidence range of internal variability of the AGMT estimates, defined as the 2.5th–97.5th percentile of the daily estimated AGMT obtained from historical CESM2 LE simulations during 1850–1950. Observed and modelled anomalies are relative to 1980–2010 climatology. b, Fractional number of EM days within a corresponding year from 1980 to 2020 for which the estimated AGMT is greater than the upper bound of the 95% confidence range. Dashed line denotes an upper bound of the 95% confidence range of internal variability of fractional EM days, which is 10.9%. c, Linear trend of the number of EM days during 1980–2020 in ERA5 and MSWEP and during 2001–2020 in ERA5, MSWEP, IMERG and GPCP. The dashed lines denote upper bounds of the 95% confidence level based on the bootstrap method estimated using the historical CESM2 LE simulations
 
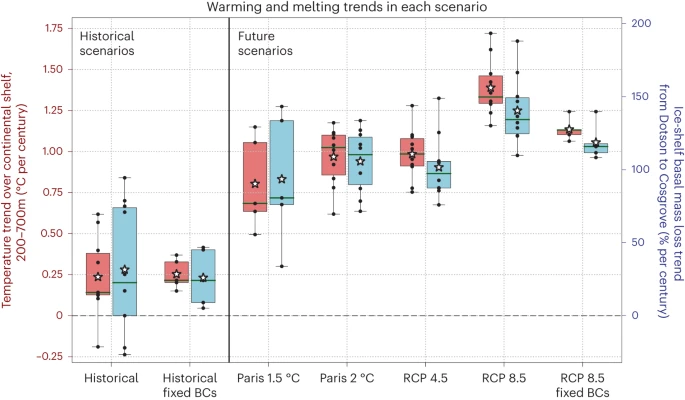
West Antarctic ice shelf melt 'unavoidable'

Increased melting of West Antarctica's ice shelves is "unavoidable" in the coming decades, a new study has warned.

These floating tongues of ice extend from the main ice sheet into the ocean, and play a key role in holding back the glaciers behind.

But as ice shelves melt, it can mean that the ice behind speeds up, releasing more into the oceans.

The study's findings suggest that future sea-level rise may be greater than previously assumed.

"Our findings seem to increase the likelihood that [current] estimates [of sea-level rise] will be exceeded," Dr Kaitlin Naughten of the British Antarctic Survey (BAS), the report's lead author, told the BBC.

This latest study, published in the journal Nature Climate Change, is the first to directly simulate how ocean warming will affect Antarctic ice shelves in response to different levels of greenhouse gas emissions. These are the gases produced when fossil fuels are burned - the main contributor to human-induced climate change.

Writeup Paper

41558_2023_1818_Fig2_HTML.png
 
More on carbon credits are useless

The Great Cash-for-Carbon Hustle

Offsetting has been hailed as a fix for runaway emissions and climate change—but the market’s largest firm sold millions of credits for carbon reductions that weren’t real.

“When you buy a carbon credit, what is the chance that somewhere in the value chain it was once owned by Shell, and that some of what you pay represents the cut they took?”

Gilles Dufrasne, a policy specialist at the nonprofit organization Carbon Market Watch, says that large-scale trading of carbon credits often diverts funds away from environmental projects.
 
Overshooting the critical threshold for the Greenland ice sheet

Melting of the Greenland ice sheet (GrIS) in response to anthropogenic global warming poses a severe threat in terms of global sea-level rise (SLR). Modelling and palaeoclimate evidence suggest that rapidly increasing temperatures in the Arctic can trigger positive feedback mechanisms for the GrIS, leading to self-sustained melting, and the GrIS has been shown to permit several stable states. Critical transitions are expected when the global mean temperature (GMT) crosses specific thresholds, with substantial hysteresis between the stable states. Here we use two independent ice-sheet models to investigate the impact of different overshoot scenarios with varying peak and convergence temperatures for a broad range of warming and subsequent cooling rates. Our results show that the maximum GMT and the time span of overshooting given GMT targets are critical in determining GrIS stability. We find a threshold GMT between 1.7 °C and 2.3 °C above preindustrial levels for an abrupt ice-sheet loss. GrIS loss can be substantially mitigated, even for maximum GMTs of 6 °C or more above preindustrial levels, if the GMT is subsequently reduced to less than 1.5 °C above preindustrial levels within a few centuries. However, our results also show that even temporarily overshooting the temperature threshold, without a transition to a new ice-sheet state, still leads to a peak in SLR of up to several metres.
 
Last edited:
Malawi battles outbreak of scabies that health experts link to climate crisis

Malawi has seen a resurgence of the infectious skin disease scabies in an outbreak that is being linked to the climate crisis. Just months after a cholera outbreak killed more than 1,800 people and affected a total of 58,982 people in August, the country has seen the return of the disease in the northern city of Mzuzu and the southern Nsanje district, with 4,152 cases registered in the past week.

Scabies is a highly contagious disease caused by tiny mites that burrow into the skin causing intense irritation and discomfort. It is spread through skin to skin contact.

“We are doing mass [public] awareness … because this is a disease related to hygiene and hygiene issues also lead to cholera,” he said. “We call on organisations and other partners to come forward to assist us.”

Health campaigners believe the outbreak could be directly linked to the climate crisis, as the current heatwave, high humidity and water shortages across Malawi make people more vulnerable to disease outbreaks.

Public health expert Maziko Matemba said Malawi needs to do more to address the impact of the climate crisis on health. “Looking at scabies, which has affected Mzuzu city and Nsanje districts, I believe that could be as a result of climate change.

“Climate change and health are very critical for Malawi and we need to do more in terms of climate change negotiations. We need to look at the impacts on people’s health to ensure we try as much to avoid these conditions,” said Matemba.

According to WaterAid Malawi, one in three people (about 5.6 million people) in the country do not have access to clean watere. About 3,100 children under five die every year from diarrhoea caused by poor sanitation, it said.

1200.jpg
 
It is getting serious...

Global wine production falls to 62-year low in 2023

Poor weather around the world is likely to cause global wine production to drop to a six-decade low this year.

Spoiler I could not find a recent good graph :
Long-Term Trends of Global Wine Market
agriculture-13-00224-g001.png

Spoiler Legend :
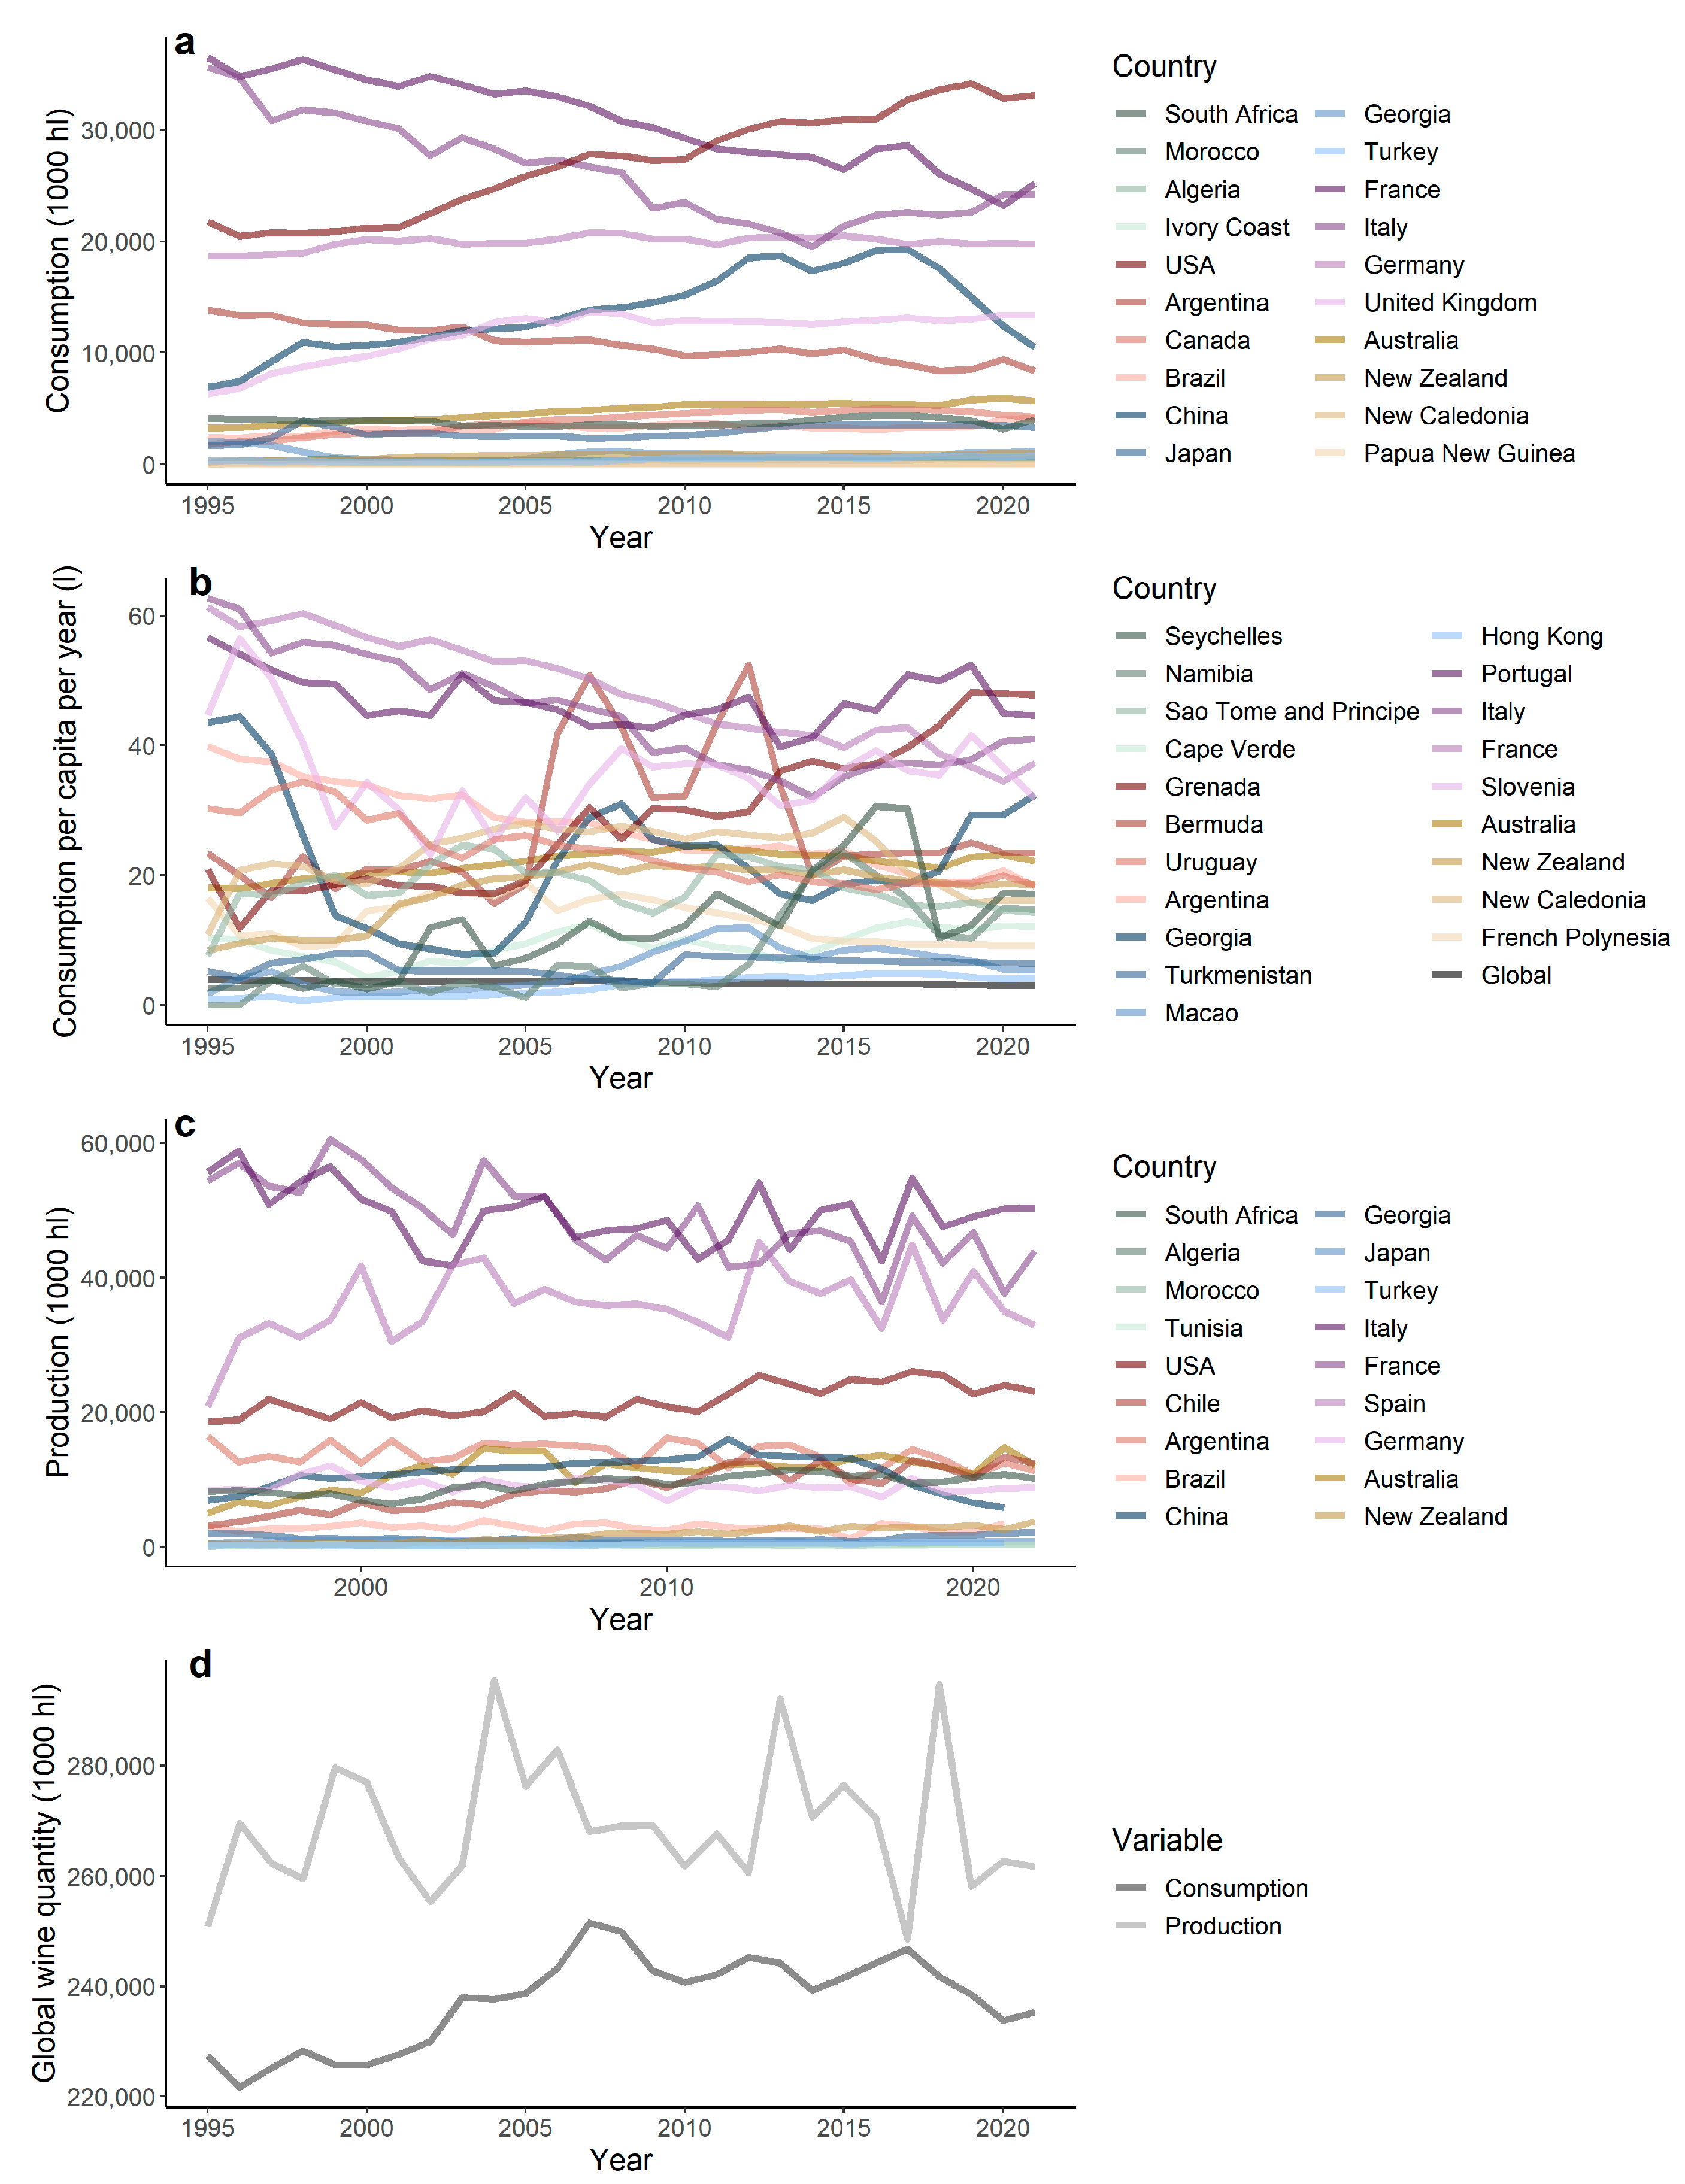
Long-term records of wine industry factors, consisting of four countries from each continent with the highest quantities in 2021 for wine consumption (a); wine consumption per capita (b); and wine production (c). Global trend lines of wine consumption and production are shown in panel (d). Countries located in Europe, Africa, America, Oceania, and Asia are denoted by scales of purple, green, maroon, golden-brown, and blue, respectively.

 
Last edited:
It is getting serious...

Global wine production falls to 62-year low in 2023

Poor weather around the world is likely to cause global wine production to drop to a six-decade low this year.

Spoiler I could not find a recent good graph :
agriculture-13-00224-g001.png

Spoiler Legend :
Long-term records of wine industry factors, consisting of four countries from each continent with the highest quantities in 2021 for wine consumption (a); wine consumption per capita (b); and wine production (c). Global trend lines of wine consumption and production are shown in panel (d). Countries located in Europe, Africa, America, Oceania, and Asia are denoted by scales of purple, green, maroon, golden-brown, and blue, respectively.


Wasn't it over produced?
 
Back
Top Bottom