You are using an out of date browser. It may not display this or other websites correctly.
You should upgrade or use an alternative browser.
You should upgrade or use an alternative browser.
[RD] Daily Graphs and Charts
- Thread starter Winner
- Start date
- Status
- Not open for further replies.

http://lolgreece.blogspot.com/2015/04/on-greek-working-hours-and-structural.htmlIt just shows how stupid/fed to useful idiots, the "yuo is of lazy" line was.
civvver
Deity
- Joined
- Apr 24, 2007
- Messages
- 5,855

Lonely and alone are not synonymous though. But I do see a lot of articles about the biggest issue in retirement not being medical care or savings, but personal fullfillment since you no longer have a job occupying your time and family isn't around as much.
SS-18 ICBM
Oscillator
Something something roads something Rome

Something something roads something Rome
Nice
")
Would be also be telling to see such a fingerprint as function of time.
Lexicus
Deity

Lohrenswald
世界的 bottom ranked physicist
I don't understand these figures
Lexicus
Deity
I don't understand these figures
The circle is a compass. The length of the blue lines corresponds to the amount of streets in the labelled city that are oriented the way the line is on the compass.
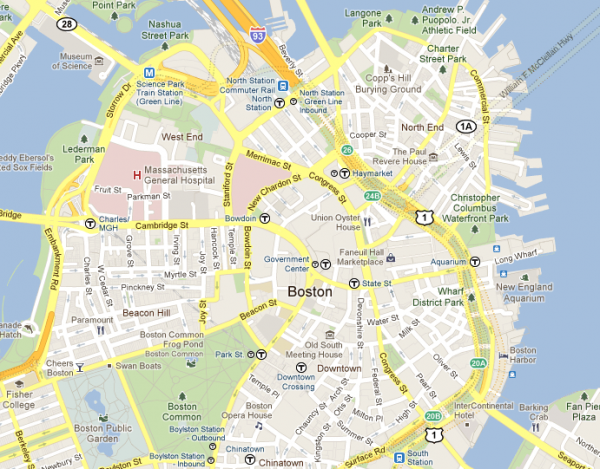
So most of those circles have crosses because most of the streets in those cities are oriented north-south and east-west. Boston has lots of streets going every which way because it looks like this:
Whereas Manhattan has a cross set at an angle because it looks like this:

Lohrenswald
世界的 bottom ranked physicist
Well then:
What does the thickness matter?
And how is there a full circle? Since streets are "oriented" two ways
What does the thickness matter?
And how is there a full circle? Since streets are "oriented" two ways
Lexicus
Deity
What does the thickness matter?
Thickness doesn't matter, the display is of discrete bars.
And how is there a full circle? Since streets are "oriented" two ways
Don't know what you mean by this.
Lohrenswald
世界的 bottom ranked physicist
Hard to describe, but
Most of the American cities you posted are a cross because citigrid but
Half of the streets about are oriented north - south, but these figures then say: half of those go south, and the other half north
Like what?
I don't understand how all the information can't be on just a half-circle, but several of these aren't symmetrical, so like
What's going on
Lexicus
Deity
I see what you're saying. I don't know how they distinguish between a north-oriented street and a south-oriented street.
warpus
Sommerswerd asked me to change this
It's a circle because a street can be facing any of 360 degrees. You can't use a half circle because there's intersections where the "north" and the "south" (for example) will not be perpendicular and will run at different angles.
Lohrenswald
世界的 bottom ranked physicist
That makes kind of sense if you imagine each intersection bend slapped in the middle but consider this:It's a circle because a street can be facing any of 360 degrees. You can't use a half circle because there's intersections where the "north" and the "south" (for example) will not be perpendicular and will run at different angles.
A street with multiple bends
A street that's a curve rather than a line
And then it doesn't add up
Also, while thinking a straight street can face any angle x from 0 to 360 degrees, you actually get a street oriented at x and x-180 degrees, so actually the only difference in orientation is from 0 to 180 degrees
I'd guess they picked a city, then calculated the middle point from the boundaries, and then all the streets are put in there relative to the middle point. So a straight street to the north of the middle will be displayed in the north, one in the south will be displayed in the south.
It probably deals with the situation mentioned above by breaking down streets in smaller parts (like every km), and determining the average direction for this part.
At least that's how I'd do it, seems logical to me.
Obviously this only works when you're letting this be done automatically by image processing algorithms or from cartographic data, and not manual.
Silurian
Deity
- Joined
- Jan 5, 2010
- Messages
- 7,567
Maybe something to do with OSMnx, never come across the program!
http://geoffboeing.com/2018/07/comparing-city-street-orientations/
Added
link to code used to generate
https://github.com/gboeing/osmnx-examples/blob/master/notebooks/17-street-network-orientations.ipynb
Each of the cities above is represented by a polar histogram (aka rose diagram) depicting how its streets orient. Each bar’s direction represents the compass bearings of the streets (in that histogram bin) and its length represents the relative frequency of streets with those bearings. For example, in Manhattan we can clearly see the angled, primarily orthogonal street grid in its polar histogram:
http://geoffboeing.com/2018/07/comparing-city-street-orientations/
Added
link to code used to generate
https://github.com/gboeing/osmnx-examples/blob/master/notebooks/17-street-network-orientations.ipynb
Last edited:
Here you can see the Rose diagram including how it has been build up for several cities
From Nature. https://www.nature.com/articles/srep03324
And it would not be (in) Nature without some fundamentals. The approach in the article is to calculate the enthropy (here as high random like Birmingham)
.png")
From Nature. https://www.nature.com/articles/srep03324
And it would not be (in) Nature without some fundamentals. The approach in the article is to calculate the enthropy (here as high random like Birmingham)
No, not the same. They actually state in their methods that they do not distinguish between north-> south and the over way around, and therefore their plots are symmetrical (so the half which is surrounded by red dots is redundant).
So still no answer .
.
This is btw also "scientific reports", the "boring" journal of the Nature series.
So still no answer
.This is btw also "scientific reports", the "boring" journal of the Nature series.

But they all have 2 order symmetry, such that they could be drawn on 180 degrees without losing information. The interesting thing is that so many seem to have more symmetry than that, such that most of the american ones have 4 order symmetry ('cos of the grid system), and many have more. Mosco is a particularly striking example, I guess 'cos of 2 grids at 45 degrees to one another?
- Status
- Not open for further replies.