[RD] Daily Graphs and Charts

Status
Not open for further replies.
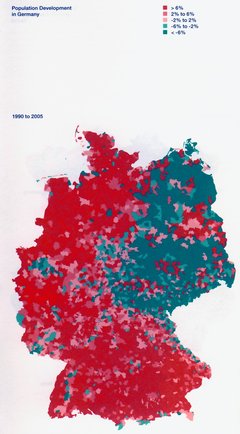
Population change in Germany 1990 - 2005, red areas = pop. increase; green areas = pop. decrease (basically former DDR):

fd8bb7520f79fbba49ceeb0812d59c28,2,0.jpg


DDR.png


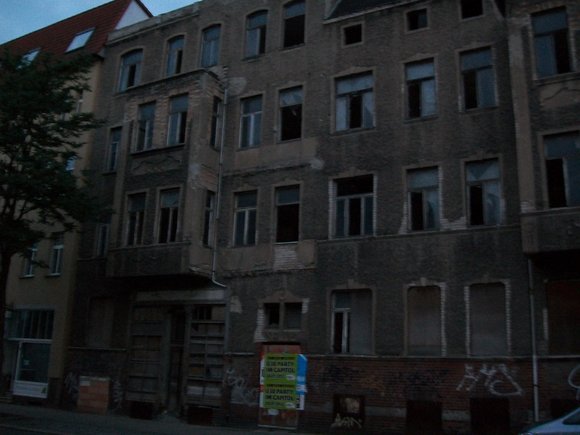
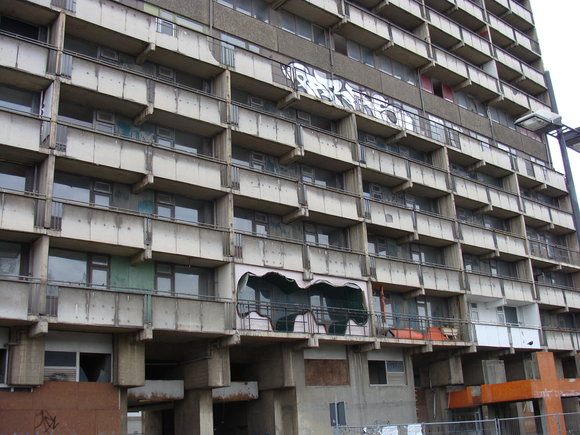
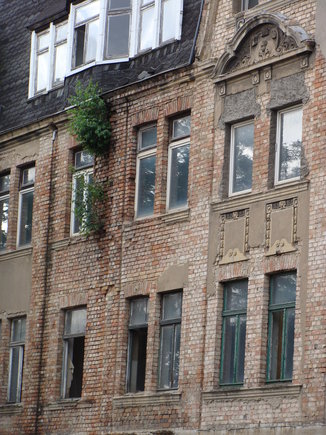
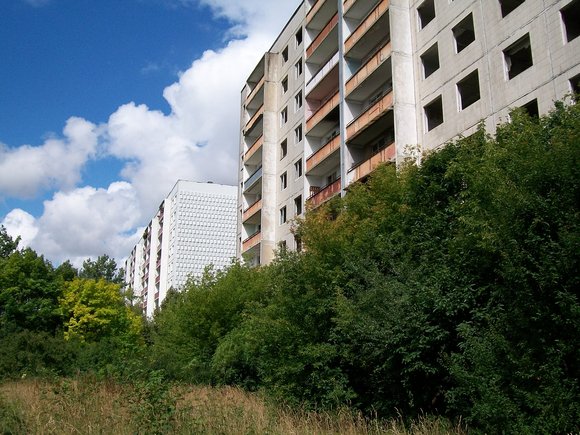
Some abandoned (?) dwelling houses in East Germany:

http://webcache.googleusercontent.c...ec+&cd=1&hl=pl&ct=clnk&gl=pl&client=firefox-a

Spoiler :
c963a4901a35b7424febc5282b24016e,2,0.jpg


cb39a5bf77bfd34cc7ca1adf4a3314e9,2,0.jpg


cf9e60381a27a23bfcc9ea005f15f049,2,0.jpg


df84f437548dca4fef8c0f8148ccdf97,2,0.jpg
 
I was also surprised, but it is apparently true:

Bremen consists of the two yellow American exclaves in the green British zone.

That was because USA #1 and much more important than Britain, so to speak:

The ports of Bremen (on the lower Weser River) and Bremerhaven (at the Weser estuary of the North Sea) were also placed under American control because of the American request to have certain toeholds in Northern Germany.

http://en.wikipedia.org/wiki/Allied-occupied_Germany#American_Zone_of_Occupation
 
Screen-Shot-2014-05-29-at-9.16.53-AM.png
 
What does "adjusted for changing employment shares" mean?

E.g. 1) if someone doing job X would have been categorised as "non-managerial" in 1964, but "managerial" in 2010, what happens to their wages in the graph?
E.g. 2) if someone doing job non-managerial job X in 1964, but gets promoted to managerial job Y in 2010, what happens to their wages in the graph?
E.g. 3) if 1964 non-managerial job X is made redundant by robots, but is "replaced" (not directly of course, but in net) by managerial job Y by 2010, what happens to wages in the graph?

I think it just means they are comparing total outlays towards managerial salaries and total outlays towards non-managerial salaries. As a percentage of total corporate salary outlays.
Adjusted I assume means that for each data point they correct for any imbalance in number of employees compared to the initial data point.
i.e. If the workforce was 40% managerial and 60% non for the first data point, and 50% of each on a later data point. Then they would correct for the changed ratio of employees by multiplying the managerial salary total by 0.9 and non-managerial one by 1.2.

At least that seems like the only rational way to calculate that at a glance.
 
I see, that seems sensible. My hypothesis is that:

(a) what is considered "managerial" today might not have been considered "managerial" in 1964. E.g. a shift manager at a shop might have been considered a high rung on a non-managerial track in 1964, but is now considered a low rung on a managerial track in 2010. This would increase the share of managerial payroll without actually increasing the average salary for management (actually it would reduce avg management salaries).
(b) the best (and highest paid) non-managerial workers in 1964 might have been promoted to managerial jobs in the interim, which would simultaneously increase managerial payroll and decrease non-managerial payroll, again without actually increasing average management salary.
(c) robots replace non-managerial jobs, which would decrease total non-managerial payroll, and thus both decrease the share of non-managerial jobs' payroll and increase the share of managerial jobs' payroll.

"Adjusting for changing employment shares" in the way you have mentioned would counteract these effects iff there is no correlation between which jobs are shifted from non-managerial to managerial and the salary of those jobs. So taking (b) as an example, I've explicitly assumed that the highest paying non-managerial workers would shift to management over the time period, meaning that there is a systematic bias towards higher paying jobs and thus adjusting for changing employment shares doesn't counteract that. There is no such explicit assumption for (a) and (c); however, I would expect a similar thing to happen there. The highest paid non-managerial jobs get "title upgrades" to "managerial", while the lowest paid non-managerial jobs get replaced by robots. Possibly.

Anyway what I'm saying is that I'm not sure what the graph really shows, but I've had a lot of fun thinking about it.
 
As a vegetarian, I find this amusing. Also might be useful for me in the future.

OKC_orals.png


Honestly though this is based off of users of a dating website, so I don't think it's the most reliable source.
 
"Oh my God this is so tasty and it doesn't even count!"
 
Only because the fossil lobby refuses to let renewables compete fairly.

Go back to history you dirty (literally) commie. Free enterprise mofo.

Take away any government subsidies to renewables and they would be completely uncompetitive. Right now they are still uncompetitive but are being force upon us at a greater cost. Spain suffered from excessive solar subsidies, Germany has almost suffered the same fate, but is financially better off than Spain and can handle for longer but are starting showing signs of cracks in the system.
 
Take away any government subsidies to renewables and they would be completely uncompetitive. Right now they are still uncompetitive but are being force upon us at a greater cost. Spain suffered from excessive solar subsidies, Germany has almost suffered the same fate, but is financially better off than Spain and can handle for longer but are starting showing signs of cracks in the system.

That's... not... :hide:

Subsidies to industry by government are not always the best thing for a society but they help depressed economies, not hurt them.
 
Take away any government subsidies to renewables and they would be completely uncompetitive. Right now they are still uncompetitive but are being force upon us at a greater cost. Spain suffered from excessive solar subsidies, Germany has almost suffered the same fate, but is financially better off than Spain and can handle for longer but are starting showing signs of cracks in the system.

This is an impressively densely packed pile of utter rubbish.
 
4_5_degrees.png
 
Was it too much trouble to draw the other possibilities? Is this what xkcd is now?
 
Um.... What?

"Survey in France: Who is, According to You, the Country That Contributed Most to Germany's Defeat in 1945?"

hF2DD50E3
 
In 1945. Which is also known as "D-Day". By "defeat of Germany", I presume, they mean "liberation of France" and not the overall situation.

Also, 45 year jump seems a bit too far.
 
Status
Not open for further replies.
Back
Top Bottom