Global Warming is Stuck in the Ice

Look up the quotes yourself then. Feel free, it's a public document available to all...
"Feel free" to examine the chart I posted above which clearly shows your so-called expert "cherry picked" the data he quoted.

And as I also said, there's plenty of observational data to support that. Like the one I already posted.
And like I "also said", "there's plenty of observational data" that shows just the opposite. Now isn't there?

Arguing with alarmists is like punching yourself in the face. :rolleyes:
I'm not the one who anonymously quoted an "alarmist" site that "cherry picks" data, while making statements that cannot be supported by the facts. :goodjob:

You can try to make all this into some sort of tin foil hat conspiracy being waged by hundreds of reputable scientists. But the overwhelming amount of evidence supports just the opposite conclusions. Not only is extreme weather growing more commonplace, most of the recent changes in global warming appear to be due to humans.
 
"Feel free" to examine the chart I posted above which clearly shows your so-called expert "cherry picked" the data he quoted.

I find it curious that you posted a chart from Watt's Up With That. And then claim it as basis for your alarmist claims.

I wonder what the other alarmists out there think of that.

And like I "also said", "there's plenty of observational data" that shows just the opposite. Now isn't there?

Link the observational graphs from institutions recording the observations (ie: not from news articles or blogs).

I'm not the one who anonymously quoted an "alarmist" site that "cherry picks" data, while making statements that cannot be supported by the facts. :goodjob:

I linked you to IPCC AR5 WG1 Chapter 2. Too lazy to look the quotes up? Or too embarrassed?

You can try to make all this into some sort of tin foil hat conspiracy being waged by hundreds of reputable scientists.

I think you mean someone else. Ziggy got it right before.

But the overwhelming amount of evidence supports just the opposite conclusions. Not only is extreme weather growing more commonplace, most of the recent changes in global warming appear to be due to humans.

I'm sorry, but you are incorrect.
 
Get back to me when this not-warming trend goes on for a couple of decades.

Escalator_2012_500.gif

I came here to post that gif.

I'm just Ziggy :)

And we wuv you. :)
 
And like I "also said", "there's plenty of observational data" that shows just the opposite. Now isn't there?

I had some free time, so I saved you the trouble. You can thank me later. :)

PS: All images linked directly from their observational institutional source.

Global Tropical Cyclone Accumulated Energy:
Spoiler :

global_running_ace.png


Global Tropical Cyclone Frequency:
Spoiler :

frequency_12months.png


Global Hurricane Frequency:
Spoiler :

global_major_freq.png


US Land-falling Tropical Systems:
Spoiler :

step6.02-01.gif


US Hurricanes:
Spoiler :

fig33.jpg


Australian Tropical Cyclone Frequency:
Spoiler :

tc-graph-1969-2012.png


US All Tornadoe (EF1-5) Frequency:
Spoiler :

EF1-EF5.png


US Major Tornado (EF3-5) Frequency:
Spoiler :

EF3-EF5.png


Global Precipitation:
Spoiler :

precipitation-figure2.gif


US Streamflow (accurate proxy of precipitation):
Spoiler :

real_us_2.gif


Global Drought (red line):
Spoiler :

nature11575-f1.2.jpg


US Drought:
Spoiler :

dk-step3.ytd.gif


Canadian Drought:
Spoiler :

AB_droughts_1402-2004.gif


US Heat Wave Index:
Spoiler :

heat-waves-figure1.gif


If you can find trends in those observations of extreme weather, then you're doing better than the thousands of scientists involved in the IPCC reports.
 

I can't possibly be bothered to read the thread.

All i wanted to say was that i am having a mediocre April day right now.
Well, at least it smells like spring.
 
So, the hurricane data is actually reasonably clear, there's no significant increase. That drought data, though, looks like it could be an issue (especially with dropping aquifers compounding the risk)
 
I find it curious that you posted a chart from Watt's Up With That. And then claim it as basis for your alarmist claims.
"I find it curious" that you think them merely posting a paragraph, which wasn't quote mined like yours were, and a chart (both from your own source!) must somehow transform them into some sort of "alarmist claim". :rotfl:

I wonder what the other alarmists out there think of that.
Why don't you ask them given that they share many of your own views? As for me, I'm merely accurately reporting what the authorities are actually saying.

I linked you to IPCC AR5 WG1 Chapter 2. Too lazy to look the quotes up? Or too embarrassed?
You should try reading the entire report, instead of "cherry picking" the sentences which support these "alarmist" views.

Again, from that chart from your very own source, which is readily available from numerous other sources such as this one:

Warmer and/or fewer cold days and nights over most land areas: very likely

Warmer and/or more frequent hot days and nights over most land areas: very likely

Warm spells/heat waves: likely

Heavy precipitation events: likely over most land areas

Increase in intensity and/or duration of drought: likely in most regions since 1970

Increase in intense cyclone activity: likely in some regions since 1970

Increased incidence and/or magnitude of extreme high sea level: likely

So, the hurricane data is actually reasonably clear, there's no significant increase. That drought data, though, looks like it could be an issue (especially with dropping aquifers compounding the risk)
Notice how he again ignored the evidence that many forms of extreme weather are indeed likely increasing. That AGW was indeed "likely" or "more likely than not" a factor with all the enumerated classes of extreme weather, and that it is "virtually certain" at least some of these forms of extreme weather will continue to increase in the future.
 
Sorry, Formaldehyde, I missed the graphs that you posted. Could you repost them? I think that AGW could still be an issue even if extreme weather decreased, but it would be good news if it did.
 
"I find it curious" that you think them merely posting a paragraph, which wasn't quote mined like yours were, and a chart (both from your own source!) must somehow transform them into some sort of "alarmist claim". :rotfl:

My source was the IPCC AR5.

Your source was a "denier" blog.

You should try reading the entire report, instead of "cherry picking" the sentences which support these "alarmist" views.

The AR5 report actually comes out saying climate change is not occurring as the models predict, and play down the drama caused by the previous AR4 report.

The "Summary for Policy Makers" however, plays up the drama and provides "sound bites" to promote alarmist views.

Again, from that chart from your very own source, which is readily available from numerous other sources such as this one:

Again, my source was the IPCC AR5 report.

Your source is a "denier" blog.

Warmer and/or fewer cold days and nights over most land areas: very likely

Warmer and/or more frequent hot days and nights over most land areas: very likely

Warm spells/heat waves: likely

Heavy precipitation events: likely over most land areas

Increase in intensity and/or duration of drought: likely in most regions since 1970

Increase in intense cyclone activity: likely in some regions since 1970

Increased incidence and/or magnitude of extreme high sea level: likely

Notice how he again ignored the evidence that many forms of extreme weather are indeed likely increasing. That AGW was indeed "likely" or "more likely than not" a factor with all the enumerated classes of extreme weather, and that it is "virtually certain" at least some of these forms of extreme weather will continue to increase in the future.

Do you actually realise these claims are based on computer models?

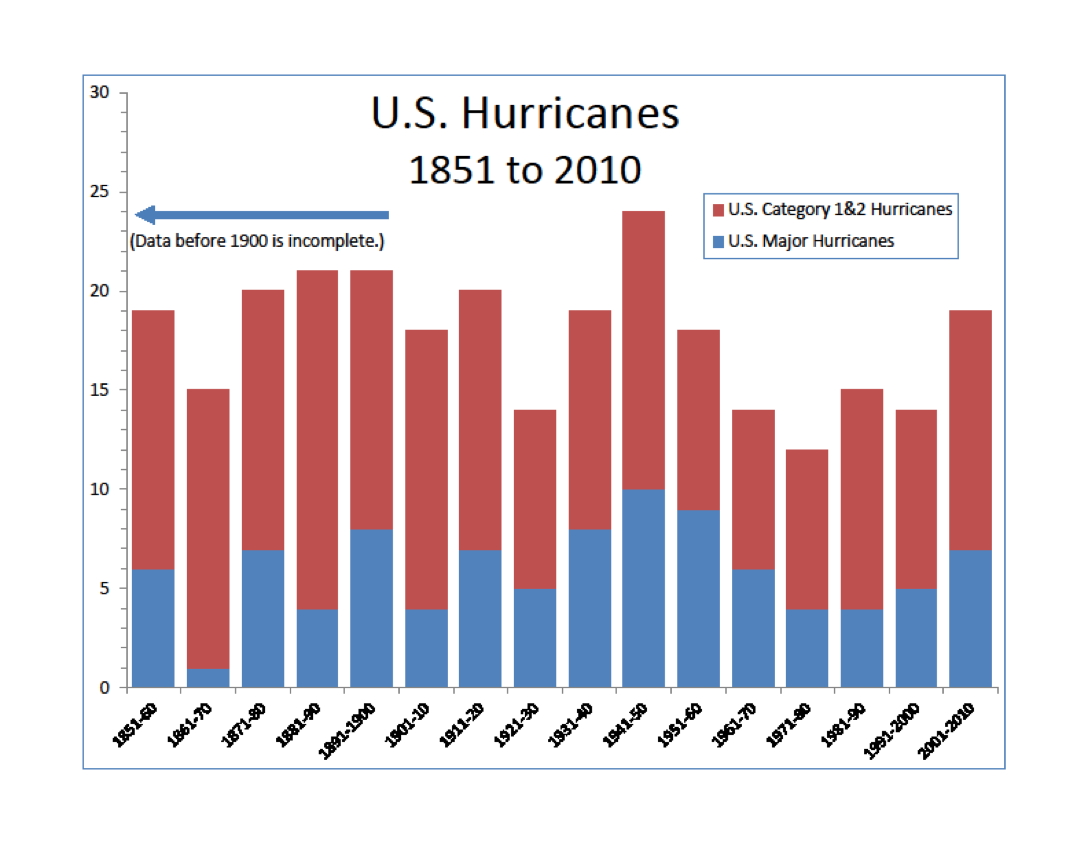
Observations, as I posted above, show there is no discernible trend in extreme weather.

Your doing science wrong Form. You're doing the typical alarmist "models differ from observations, so the observations are wrong". That's anti-science.

----------------------------------
EDIT:
Also looking at your table, nearly all of them are NOT extreme weather events. Of the ones you list only heat waves, drought and tropical cyclones are extreme weather events. You also misled everyone here and "upped" the confidence levels of all three!

From the chart:
Heat waves: Form says "likely", the TRUTH says medium confidence
Drought: Form says "likely", the TRUTH says low confidence
Tropical cyclones: Form says "likely", the TRUTH says low confidence

The chart does not list tornadoes, hurricanes, floods, storms and many other extreme weather events.
 
Regardless of whether global warming is actually happening and is man made or not, can we at least all agree it's nowhere near the proportions supposed experts like Al Gore claimed? Ten years ago he was saying polar ice would be completely melted by 2013 as in all gone, no polar ice. He was even close. The issue I have with global warming alarmists is they are not pushing an agenda for the good of the planet but for their own wallets. Al Gore has made a mint off this garbage and scientists need government funding for their projects and preaching apocalypse is how they get it at the expense of tax payers.
 
The prophetic doomsayers for the new world for the same old reasons? I'd say that sounds pretty accurate. And they do the same damage to their base cause that the ''traditional'' doomsayers always have.
 
Regardless of whether global warming is actually happening and is man made or not, can we at least all agree it's nowhere near the proportions supposed experts like Al Gore
Let me stop you right there ...

and scientists need government funding for their projects
Funding science is a good thing, right?
 
Regardless of whether global warming is actually happening and is man made or not, can we at least all agree it's nowhere near the proportions supposed experts like Al Gore claimed? Ten years ago he was saying polar ice would be completely melted by 2013 as in all gone, no polar ice. He was even close. The issue I have with global warming alarmists is they are not pushing an agenda for the good of the planet but for their own wallets. Al Gore has made a mint off this garbage and scientists need government funding for their projects and preaching apocalypse is how they get it at the expense of tax payers.

Yes, Gore has made a lot of money off his programs and companies, but I'll interject about the scientists.

You can't really blame the scientists. If a Govt official came to you and said, "we'll give you $10 million to go find evidence of human global warming", you'd take the grant. Not taking it would mean out of work.

Really, it's the Govt driving the allocation of grant money to programs, not the scientists.
 
No because you see cheezy we're humans and we can survive simple stuff like the climate changing and parts of the planet being flooded and potentially thousands (if not millions) of people dying or being made homeless and having to become refugees, and entire countries being flooded and destroyed.

I'm sure it won't matter anyway, we'll probably have destroyed the earth in some sort of nuclear war before the worst of climate change hits us!
 
Find a way to reduce pollution and move away from low coastlines. Maybe a sunscreen in space :)

I'd be looking for ways to sequester water, some of the hot barren landscapes would benefit from a nearby body of water. I understand the Red Sea is geologically close to feeding the East African rift.
 
Sorry, Formaldehyde, I missed the graphs that you posted. Could you repost them? I think that AGW could still be an issue even if extreme weather decreased, but it would be good news if it did.
It is a summary chart, not a graph. I've posted the link 3 times already. But here it is yet again, this time without embedding the link in text, or making it a spoiler because the chart is too large to be properly displayed in this forum.

http://lackofenvironment.files.wordpress.com/2013/11/ar5-table-spm-1.jpg

My source was the IPCC AR5.

Your source was a "denier" blog.

Again, where do you think that paragraph and chart are from? You might want to check out page 127 of the final technical summary to find that very same chart. :rotfl:

http://www.climatechange2013.org/images/uploads/WGIAR5_WGI-12Doc2b_FinalDraft_TechnicalSummary.pdf
 
Pray, tell: what exactly is wrong with a little alarmism? Climate Change is alarming, and whether it means no arctic sea ice in 2016 or 2030, we must start to do something about it now.

There's a huge difference between 1C warming by 2100 and 4C warming by 2100.

One scenario gives us the time to plan the transition properly, with proper economic/social/environmental/geopolitical/cultural/etc evaluation ensuring the continuing prosperity of humanity.

The other scenario involves handing over massive amounts of power to the wrong people, wasting trillions and trillions on inefficient measures (which fail in the mid-long term) and end up in a worse place economically/socially/environmentally/geopolitically/culturally/etc.

Scenario 1 is what observations are showing, whilst scenario 2 is what alarmists are pushing.
 
Back
Top Bottom