You are using an out of date browser. It may not display this or other websites correctly.
You should upgrade or use an alternative browser.
You should upgrade or use an alternative browser.
[RD] Daily Graphs and Charts II: Another 10,000 to come.
- Thread starter Cutlass
- Start date

KMRblue1027
Deity
That's about to get much much worse. Most climate models suggest anywhere from 300m to over a billion displaced over the next few decades.
This is one of the things that really worries me about it. There is so much trouble now, and this is with it on easy. If large areas of the tropics become uninhabitable in the next decade or two it could be a choice between open borders or WW3.That's about to get much much worse. Most climate models suggest anywhere from 300m to over a billion displaced over the next few decades.
KMRblue1027
Deity
Yeah completely with you there the sections of the globe that will become uninhabitable soon are ether very poor and will be unable to deal with it or already unstable. Pakistan terrifies me in that regard as it's one of the places that most commonly is projected to be largely uninhabitable and sooner then you'd think but unlike island nations or a Sub-Saharan African state Pakistan has a very large population and nuclear weapons.
Lexicus
Deity
If the Thwaites glacier collapses, which could happen in the next century, sea-level rise of 3 meters will be locked in
Lexicus
Deity
The Thwaites ice-shelf, which is one of the largest in Antarctica, is due to collapse in the next few years. That page makes for cheery reading.
Yes, just to be clear the ice-shelf is the end of the glacier and is what is stopping the whole glacier from essentially just falling into the sea.


In the context of Australia which has no nuclear power and where the right wing opposition has just floated this extremely vague policy of slowing down the renewables transition in factor of replacing half a dozen current or former coal plants with nuclear power plants:

The genderedness is so bloody funny to me. STEM men and their big feelings.
The genderedness is so bloody funny to me. STEM men and their big feelings.
stfoskey12
Emperor of Foskania
I wonder how that has changed in the past 40 years.
Narz
keeping it real
How is it funny?The genderedness is so bloody funny to me. STEM men and their big feelings.
The genderness is funny weird but not funny ha ha.
Also "funny":
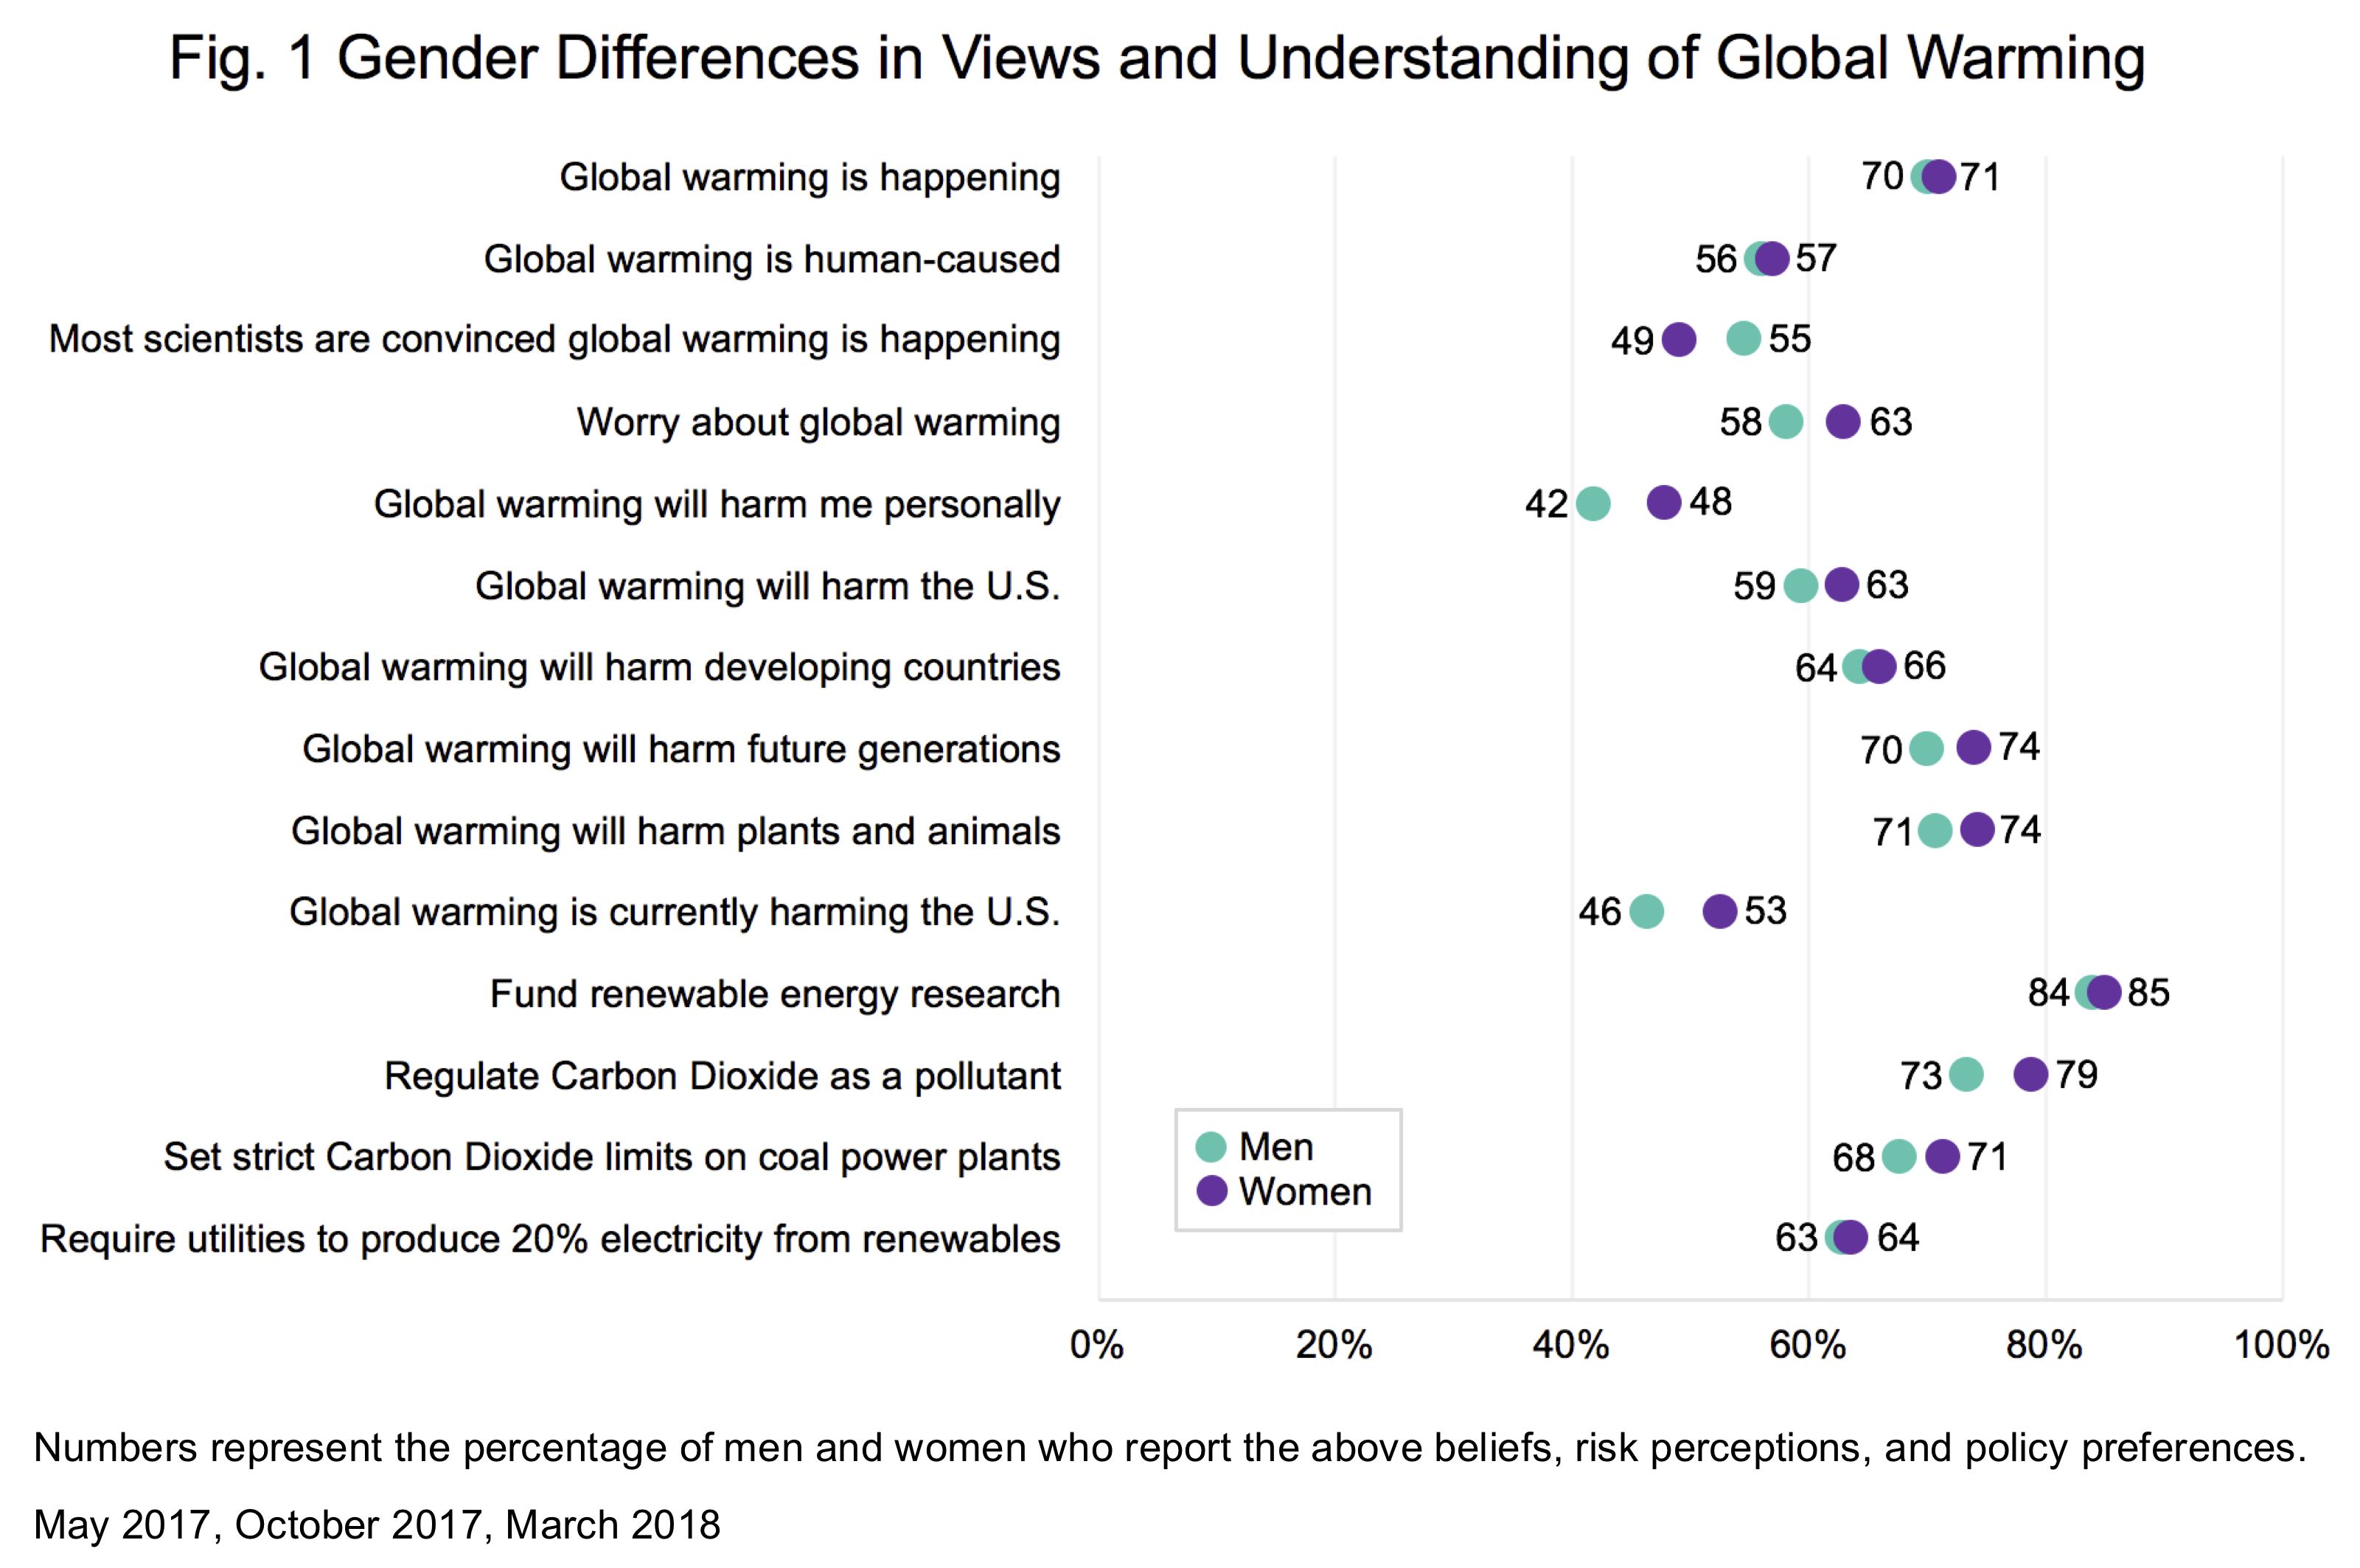
In our research, we find that, although a similar proportion of men and women think global warming is happening and is human-caused, women consistently have higher risk perceptions that global warming will harm them personally, and will harm people in the U.S., plants and animals, and future generations of people (Fig. 1). Also compared with men, a greater proportion of women worry about global warming, think that it is currently harming the U.S., and support certain climate change mitigation policies, specifically regulating CO 2 as a pollutant and setting strict CO 2 limits on coal power plants.
Women are less likely than men, however, to say that most scientists are convinced that global warming is happening. The gender gap in this form of knowledge has remained generally stable since 2010, although men’s understanding of the scientific consensus has improved over time (Fig. 2). This is a surprising finding given that women are more likely than men to view climate change as harmful.
Spoiler Rant :
What is "Regulate CO2 as a pollutant" supposed to mean? Has anyone suggested that the regime for controlling global CO2 release is well modelled by any current pollutant laws?
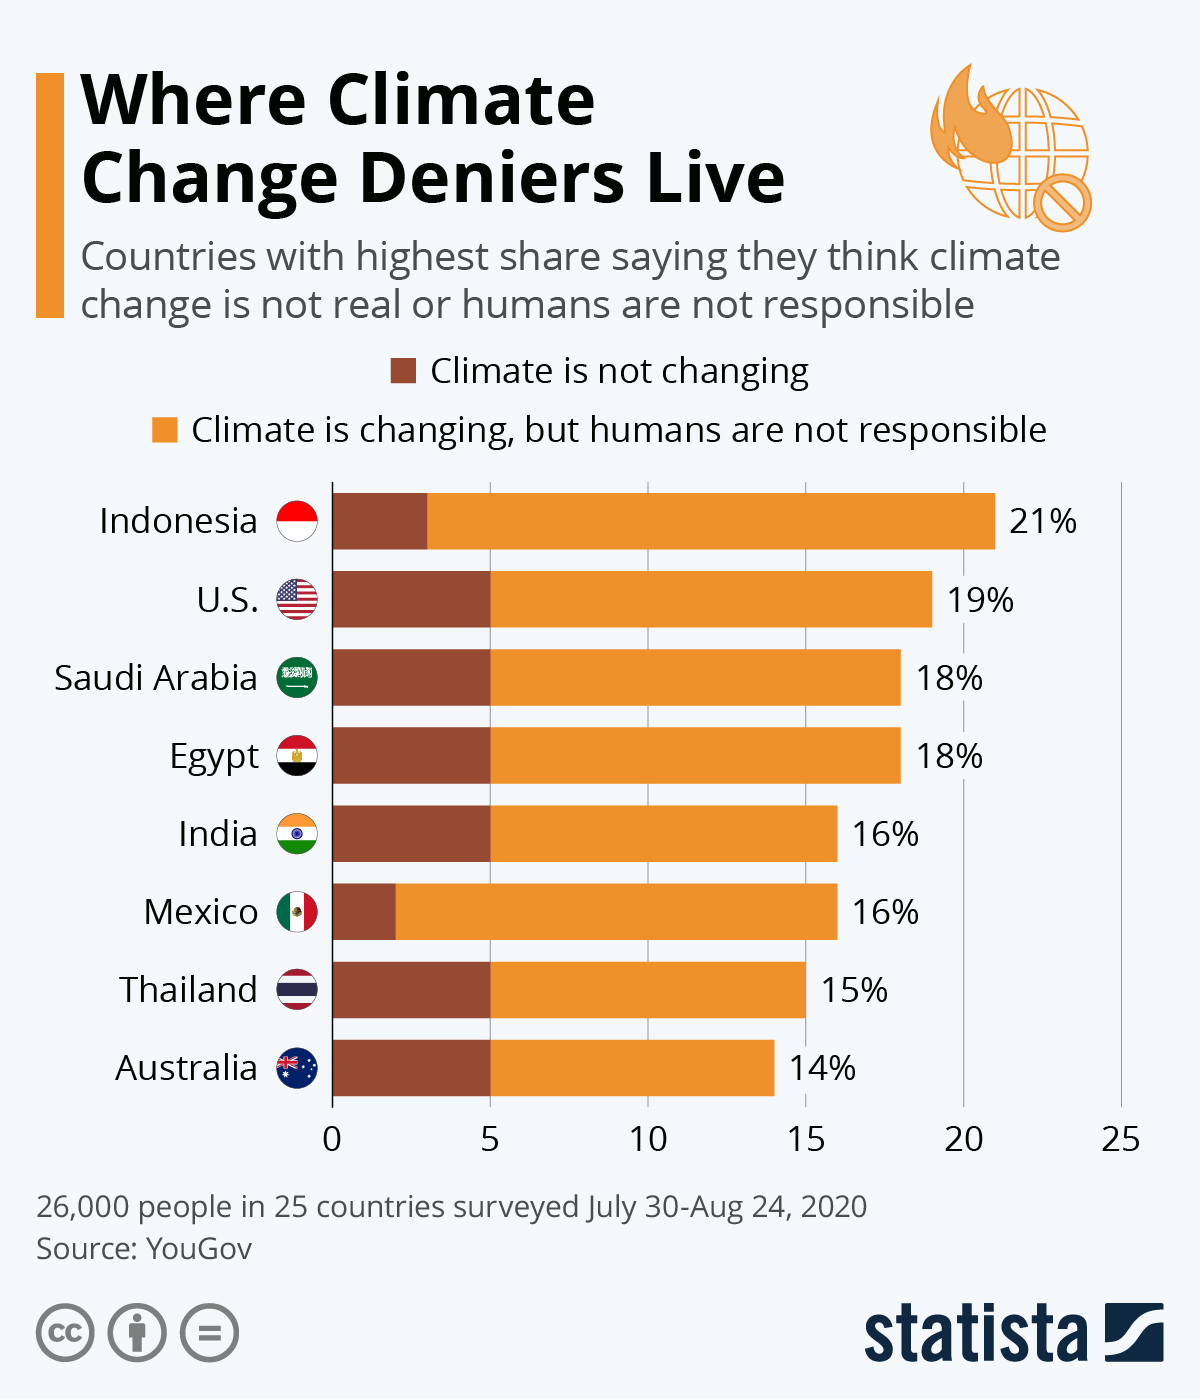
Also "funny":
Last edited:
Narz
keeping it real
Mostly highly religious places (except Oz)
The male female difference is pretty scant for most of those questions, women are more risk averse in general that's already well known
By geographic area or urban vs rural would likely be much higher difference
The male female difference is pretty scant for most of those questions, women are more risk averse in general that's already well known
By geographic area or urban vs rural would likely be much higher difference
That is a good question, and it is not easy to find the answer. I did find this, which is not related but interesting and this is supposed to be charts.By geographic area or urban vs rural would likely be much higher difference


I am not convinced they have the maths right but they know better than I
LDV = Light Duty Vehicle (LDV) fleet, including passenger cars and light commercial vehicles (e.g. pick-ups and delivery vans)
Reference Technology Scenario (RTS) = limits the temperature increase to 2.7 °C by 2100
2-Degree Scenario (2DS) = limits the temperature increase to 2 °C by 2100
Beyond 2-Degree Scenario (B2DS) = zero emissions by 2060 and will limit the temperature rise to 1.75 °C by 2100


I like the graph as it has so many meaningful features. The absolute X position is the proportion of total generating capacity, the X component of the vector is the proportional growth rate over 10 years, the absolute and component Y obviously the same for cost and the angle the "learning rate by installation".
Last edited:

Similar threads
- Replies
- 4
- Views
- 458
- Replies
- 128
- Views
- 14K
- Replies
- 352
- Views
- 22K