[RD] Daily Graphs and Charts

Status
Not open for further replies.
schultz.jpg


voter fraud in iowa is a huge omfg problem guyz.


bentele_obrien.png


the more African American's there are, the more restrictive voting needs to be!


I'm ashamed at Maine. There are hardly any colored people in the state.

Maine Race / Ethnic Groups
Non-Hispanic Population
White 1,254,297
Black 15,154
American Indian 8,210
Asian 13,442
Pacific Islander 313
Some Other Race 1,014
Two or More Races 18,996
Hispanic 16,935
 
Could someone comment how good/bad this map is? They got at least Slovakia (And Bavaria) wrong, so I'm curious if they at least nailed other countries right.

"Kerstman" (the Netherlands & Flanders) is correct.
 
It's not that the more black people there are the more voting restrictions are passed, it's the more fear of black voters the more voting restrictions are passed. So it's a function of things other than percent or total of black voters in the state.
 
It's not that the more black people there are the more voting restrictions are passed, it's the more fear of black voters the more voting restrictions are passed. So it's a function of things other than percent or total of black voters in the state.
Well, hopefully Idaho has good health insurance.
 

This is interesting. It's true that black people are apparently 4 times more likely to be arrested for possession than white people (assuming the figures are reliable). Which indicates an iniquity, I suppose.

Yet the chance of any black person getting caught is less than 1%. And 1% of 15% is... er... what percentage of the whole population? No, no. That's the wrong way round to think of it.

Hmm. I'm not sure what to make of it.
 
The blue is the total debt across the USA, while the red is per student, so without knowing the evolution of the number of students, this graph is useless.

edit: :gripe: 
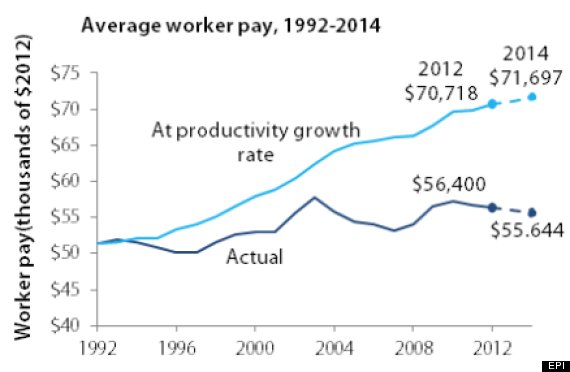
And the red graph has a pretty useless y-axis.
 
Nah, to even keep debt per student the same, you'd need student growth of 30 per cent growth per annum. Given the United States population growth rate and mature education system that seems improbable. So it's safe to suppose that debt per student is growing very fast.
 
Nah, to even keep debt per student the same, you'd need student growth of 30 per cent growth per annum. Given the United States population growth rate and mature education system that seems improbable. So it's safe to suppose that debt per student is growing very fast.

If the graph was better, I wouldn't have to suppose things.
 
13% per annum, not 30% per annum. If it was growing at 30% per year it would be about $3.2 trillion by now.
 
Mise said:
13% per annum, not 30% per annum. If it was growing at 30% per year it would be about $3.2 trillion by now.
it seems mathematical aptitude declines with alcohol consumption
 
tCb5jkT.png
 
Status
Not open for further replies.
Back
Top Bottom