You are using an out of date browser. It may not display this or other websites correctly.
You should upgrade or use an alternative browser.
You should upgrade or use an alternative browser.
[RD] Daily Graphs and Charts
- Thread starter Winner
- Start date
- Status
- Not open for further replies.
SS-18 ICBM
Oscillator
It's in stupid units, but it'll have to do.

Heretic_Cata
We're gonna live forever
Can't understand a thing, can someone convert it to fathoms please.
")
What I don't understand about that chart is the scale. Surely most TVs are on the 25"-55" range, and the viewing range is rarely beyond 15' for a TV. Who owns a 140" TV, and who watches TV 40' away??
The relevant range of both sizes and viewing distances is confined to a small corner on the lower left.
The relevant range of both sizes and viewing distances is confined to a small corner on the lower left.
SS-18 ICBM
Oscillator
I think that's the point.
There are two points being made there, and they are contradictory.
1 - Resolution doesn't matter at far away viewing distances, but nobody really views TV from that far (so resolution differences do matter).
2 - Resolution differences only begin to matter more at really big TV sizes, which most people don't have (or don't even exist) - so resolution differences don't matter much.
SS-18 ICBM
Oscillator
But there is only one resolution that is not yet established...but is being heavily marketed nevertheless.

SS-18 ICBM
Oscillator
I think I'd prefer it in proportions of a population.
Paul in Saudi
Emperor
Domen
Misico dux Vandalorum
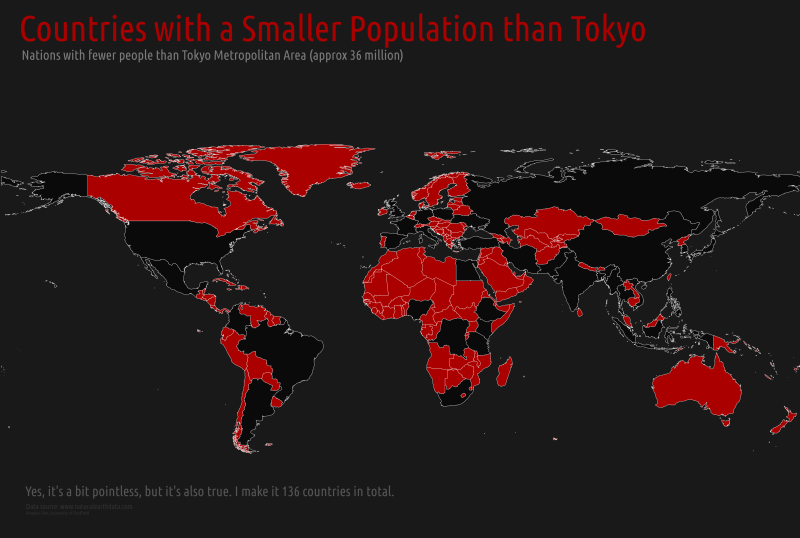
How about "Continents with a Smaller Population than Tokyo" ???
Terxpahseyton
Nobody
- Joined
- Sep 9, 2006
- Messages
- 10,759
Australia. (was that the joke?) And Antarctica. And I just noticed that Europe is the only continent not starting with an A (disregarding prefixes like 'north' or 'south').
Monsterzuma
the sly one
- Joined
- Jun 1, 2008
- Messages
- 2,984
and we all know why europe even is a "continent".
gay_Aleks
from the river to the sea, Palestine will be free!
All hail Euasafrica! (And Oceania.).

Terxpahseyton
Nobody
- Joined
- Sep 9, 2006
- Messages
- 10,759
Because white-people-land! Hooray!and we all know why europe even is a "continent".
Domen
Misico dux Vandalorum
Much of Asia also happens to be white-people-land.
BTW - North and South Americas are connected as well.
BTW - North and South Americas are connected as well.
Terxpahseyton
Nobody
- Joined
- Sep 9, 2006
- Messages
- 10,759
Not reallyMuch of Asia also happens to be white-people-land.
- Status
- Not open for further replies.