[RD] Daily Graphs and Charts

Status
Not open for further replies.
DTL6tTIU0AAzr53.jpg
 
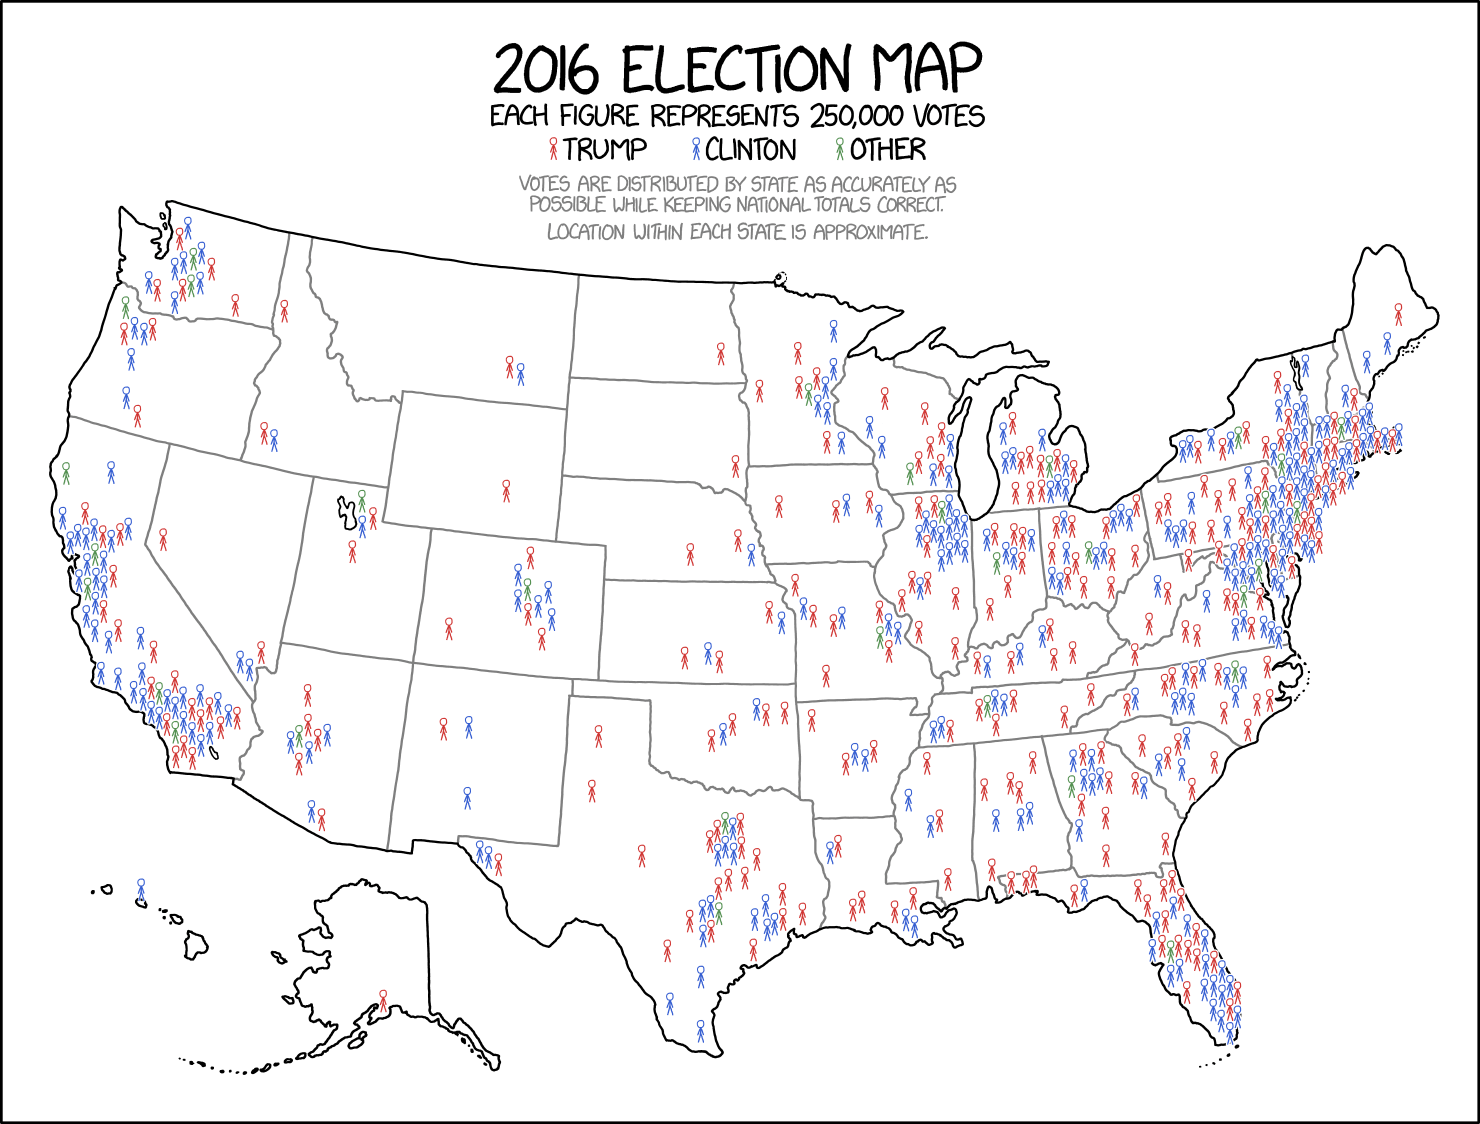
Turnout was 60%, above the national average. Hawaii has 1.4m people and there were 425k votes. Clinton got about 260k and the 128k Trumpkins there will have rounded down to zero due to rounding decisions across the rest of the country and possibly to preserve proportionality with the little blue man there.
 
Turns out that Hawaiian figure must have been of registered voters. According to this they WERE the lowest turnout state, followed by West Virginia, Texas and Tennessee.
 
Turns out that Hawaiian figure must have been of registered voters. According to this they WERE the lowest turnout state, followed by West Virginia, Texas and Tennessee.
That is an interesting (and short) read. It is not a graph, but the stats are a bit frightening if you are into democracy:
US Vote Foundation said:
Just 33 of 435 House seats were even close, the lowest since World War II. Three-quarters were won by landslide margins for 20 points or more.
...
campaigns devoted 95% of candidate visits and 99% of ad dollars to just 14 states, over half to Florida, North Carolina, Ohio and Pennsylvania.
 
That is an interesting (and short) read. It is not a graph, but the stats are a bit frightening if you are into democracy:

On the contrary, US elections are full of valuable learning experiences:
  • don't let politicians draw their own electoral boundaries
  • don't count votes for a president using a weird rurally malapportioned set of blocky sub-votes, no, shut up, I don't care if you're a federation, it's still a stupid idea, representing small jurisdictions is what the Upper House is for
  • don't use first past the post voting
  • don't have fifty different, often bureaucratically difficult methods of enrolling and being eligible to vote, also controlled by local politicians
  • actually, strongly consider not having single member electorates, they're not worth it
  • maybe vote on weekends?
 
Who maintains most of these trails? Is it private organizations or some sort of a federal body or maybe a state one that spans several states?


Much of it is the national parks service. I think some is other federal agencies, and part of it is state parks. And there are a lot of volunteers who work on it.
 
Sorry yeah. I am in the habit of thinking of driving distance in terms of a period of time... ie I live 3 hours from Sydney and 7 hours from Melbourne. You can probably appreciate why!
 

Not sure that their data supports their conclusions. Yes, there are areas on some of their maps that are "not connected," but they conclude they represent "disadvantaged rural areas" when in fact in many cases there isn't really much of anyone there to be disadvantaged. The Saudi Arabia example that they say is "an anomaly" because such a high wealth country has such dark areas...those areas are genuinely unpopulated desert.

I certainly don't know Australia well enough to state a conclusion on that, but, Arwon: is central Australia full of poor rural people disconnected from modern conveniences, or is it mostly vast tracts of practically uninhabited wilderness?
 
is central Australia full of poor rural people disconnected from modern conveniences, or is it mostly vast tracts of practically uninhabited wilderness?

Yes?
 
Status
Not open for further replies.
Back
Top Bottom