[RD] Daily Graphs and Charts

Status
Not open for further replies.
upload_2017-10-24_10-8-3.png
 
If I would live in Greece, I would not trust the government as well, I would only theoretical believe in democracy because there is nothing better, I would by lack of a positive influence of the government on experts, also trust civil society as such the most... but who is then deciding which expert has the last word ?

And why would I trust a government, when that government is not trusting me.... fundamentally not trusting me, because if I want a new drivers license, I don't get one if I did not vote in the election.
(Greece not the only country with compulsory voting)

Not sure if that is true (re driver's license, cause i don't drive), but voting is only nominally compulsory here. Turn-out is rarely above the mid 60%, iirc. I haven't voted in most elections i was eligible to vote in.
 
[table=head]ethnicity/gender|Obama12|Romney12|Clinton16|Trump16|Clinton gain|Trump gain|swing
white men|35|62|31|62|-4|0|R+4
white women|42|56|43|52|+1|-4|D+5
AfrAm men|87|11|82|13|-5|+2|R+7
AfrAm women|96|3|94|4|-2|+1|R+3
latino men|65|33|63|32|-2|-1|R+1
latino women|76|23|69|25|-7|+2|R+9
all others|66|31|61|31|-5|0|R+5
[/table]
source: CNN exit polls

"Whitelash!"
Feminist math.

The fact that i had to make this while there's a gazillion evulwhitemen graphs speaks volumes.
The fact that i had to fetch DC&G from page #2 because page #1 is full of Trump nonsense also speaks volumes.
 
Last edited:
What's the margin of error on your exit poll (especially for subgroups)?
What happened to turnout of these subgroups?
I believe that by now, there's better data than the early exit polls, let me have a look.
 
How many grand narratives survive a confrontation with data?
 
In your eagerness to pick a fight, you might have overlooked that I was not disagreeing with you.
 
People who didn't vote and named Registration problems + inconvenient polling place made up 0.9% of the total votes cast, according to my calculation. Although the election was decided by less, that's not enough to swing it. Out of town is another big item, with roughly 1.1% of the total votes cast, and young people (=Clinton voters) score very high there. One could argue that more opportunities for absentee ballots could help there. Then there's the big Other Reason category of which we know little.
Anyway, based on this data, arguing that voter suppression cost Clinton is possible, but not very convincing (you need almost all of the suppressed votes to be democrats). If one would have state-level data that shows these problems to be especially important in Michigan, Pennsylvania and Wisconsin, one could get there.**

Either way, the 'not interested', 'did not like candidates/issues' and 'too busy' groups are much bigger groups where I would focus my attention if I was campaigning.

* For the calculations, this table lists 19 million people who were registered but did not vote. Roughly 137 million votes were cast in total.
** Another facet not covered by this data set is the number of people who aren't registered to vote due to voter suppression.

The big one is that in Florida a million people are banned from voting.
 
I've never heard of this. Details?
 
Felony convictions.
 
What is the risk of letting the government influence the generation of statistics? Quite a lot: Public Health England got their consultants to fiddle the figures to show that alcohol is worse than it really is:
Original Graph:
sarg-newer-lower.png

After PHE got them to add a risk of for example assign people drinking at very low levels a risk of acquiring alcoholic liver disease and similar conditions:
sarg-older-higher.png

Also note that the 21 units line in the top graph is only the point at which the risk gets back to that of total abstinence, not that which is equivalent to the gain you get from drinking.
 
I don't drink alcohol, but it is said that a little bit (wine) every now and then can have a beneficial effect.
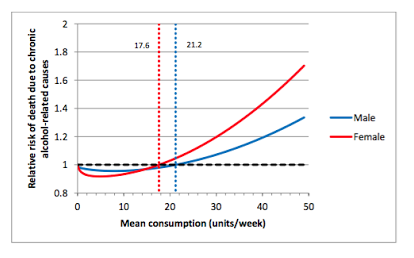
That is shown in the above graph by the dip before the dotted line.

Though from the y-axis this may only show part of the beneficial effect.
 
Status
Not open for further replies.
Back
Top Bottom