[RD] Daily Graphs and Charts II: Another 10,000 to come.

Screenshot-2022-04-19-at-14.30.15.jpg


https://www.thelocal.fr/20220419/in...eu-citizens-live-in-european-union-countries/
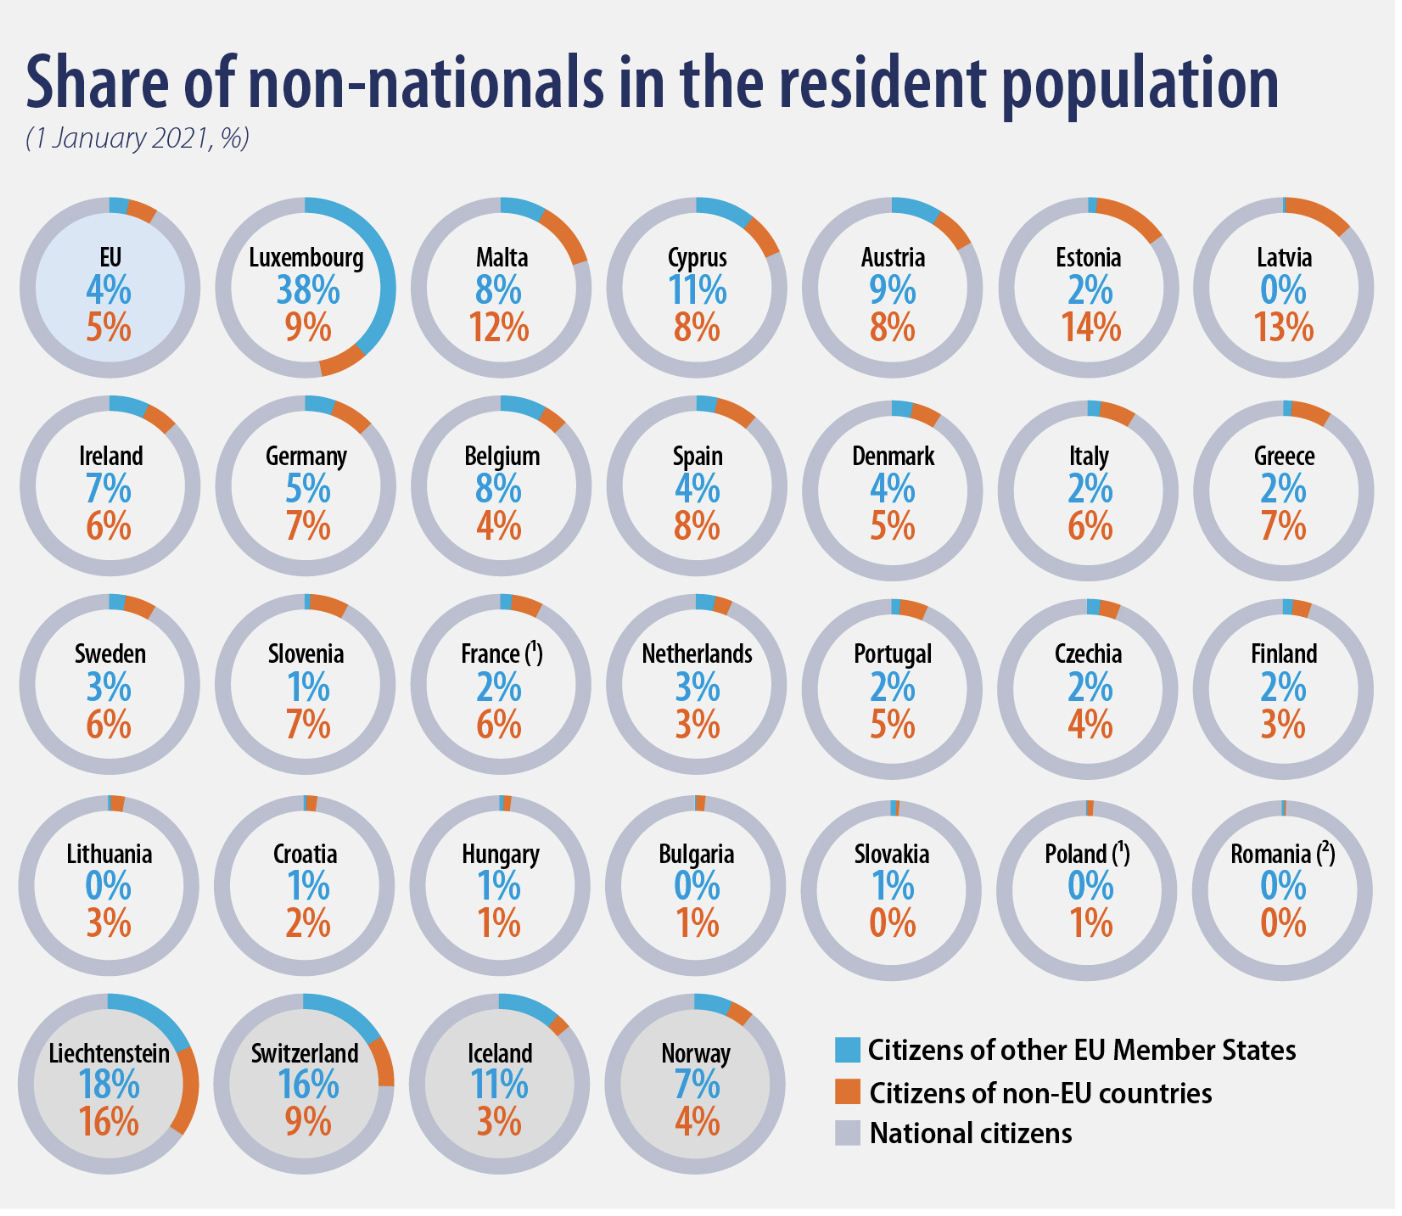
https://ec.europa.eu/eurostat/web/products-eurostat-news/-/ddn-20220330-2

TBH no surprise there for the Eastern European countries, but that has probably changed now with the war. Surprised that there's so comparatively little in Sweden and the Netherlands though, and rather many in Austria.
 
Aside from the micro states, this seems like mostly just a measure of how bad different European countries are at providing citizenship paths to long term residents
 
I interpret that differently.
Just nobody wants to go to Eastern Europe. The outliers there are the ones on the Russian border, where that does make a lot of sense. Otherwise this seems to be rather equaly distributed.
Luxembourg and Austria are indeed outliers, but the former has EU institutions, the latter has UN institutions (the only way I can explain that).
And yeah, Malta and Cyprus... I think in both cases refugees might have some impact, and also Norther Cyprus (no idea how that is counted though).
And getting citizenship in the Netherlands is rather easy.
The only place where I can see there an impact regarding citizenship is Cyprus's golden passport, but not really for any other country.
 
Spain, Ireland, Cyprus and Malta's figures have presumably changed significantly with Brexit. On that note why are Norway and Switzerland included but not the UK?
 
r00nEx4.png
 
saw0622Brus31_d.png

Source (long read, but has some good stuff)
 
d41586-022-01387-7_22071320.jpg

Source (really long, and I have not read it but it may be interesting to those involved in education)
 
Schermopname (1051).png
saw0622Brus31_d.png

Source (long read, but has some good stuff)

That meteor changed sunlight, temperature, etc, etc for species needing sunlight like plants and species in the foodchain downstream plants.
But not that much change for the soil itself being a reservoir of biomass.
The amount of biomass in the terrestrial soil being similar-bigger than living on the terrestrial soil.
https://en.wikipedia.org/wiki/Biomass_(ecology)

The general reason why so many small mammals survived the meteor climate change is, as I understand it, from eating products of the soil, including insects and organisms living in the soil or close by the soil.
Fungi, the biggest biomass, acting like plants on the surface, being the base of the foodchain.

https://www.sare.org/publications/building-soils-for-better-crops/the-living-soil/
 
d41586-022-01387-7_22071320.jpg

Source (really long, and I have not read it but it may be interesting to those involved in education)

I'm feeling very suspicous about that many of the evidence charts kinda look identical. There must be something fishy.
 
I'm feeling very suspicous about that many of the evidence charts kinda look identical. There must be something fishy.
You see they are basically plotting ordinal categories, so the ones that look the same all had the maximum effect they could measure, between 46 and 69 studies and cost less than £80 per kid.
 
Aaaah.
There's the possibility though that they also have the exact same studies, and that they just overlap, because they did the same thing. Making the correlation between the interventions extremely high and the result biased.

Why did they plot ordinal coordinates if they do seem to have the exact data points o_O?
 
file-20210428-23-1dtmwd3.png

Brain to body size plot highlighting humans and hominins (species ancestral to humans) in red, dolphins in black, other toothed whales in grey, bears in blue, and seals and sea lions in purple.
Source
 
I wonder what the other dots up there are?
I THINK they have separated the toothed and baleen whales, and only shown the toothed whales. Here is split up diagram from the paper:

abe2101-f2.jpeg

Spoiler Table of natural log of sizes, biggest brains :
[table=head]
Species|Body|Brain|Human readable
Physeter_macrocephalus|17.4289388305302|8.9641840463529|Sperm whale
Balaenoptera_physalus|17.3187057075806|8.86945862775014|Fin whale
Megaptera_novaeangliae|17.4870233304558|8.77012852753818|Humpback whale
Fossil_Mammuthus_columbi|16.0978929436408|8.73745258755058|Columbian mammoth
Loxodonta_africana|15.286414184145|8.66676253579103|African bush elephant
Orcinus_orca|14.532862427221|8.63355299253243|Killer Whale
Fossil_Palaeoloxodon_antiquus|15.1102048483059|8.60263667323371|Straight-tusked elephant
[/table]
From supplementary data
 
I was surprised that the 4th and 7th largest brains were in extinct elephant like animals, the 5th in the African Elephant and at least 32 known animals have bigger brains than us.
 
Spending money on research helps. Now that is not surprising.

d41586-022-01669-0_23164594.png

d41586-022-01669-0_23170402.png

Source
Spoiler Related graphs, note they are older :
Research-and-development-budgets-in-2011-by-country-Size-of-circles-indicate-the.png

Research and development budgets in 2011, by country. Size of circles indicate the relative amount of research and development (R&D) spending by each country. GDP, gross domestic product. I am not sure I really understand, does Greece not pay its scientists and Israel pay them loads? Or do they choose different fields that cost more in kit?
world-map-research-development-GDP.jpg

 
Back
Top Bottom