[RD] Daily Graphs and Charts II: Another 10,000 to come.

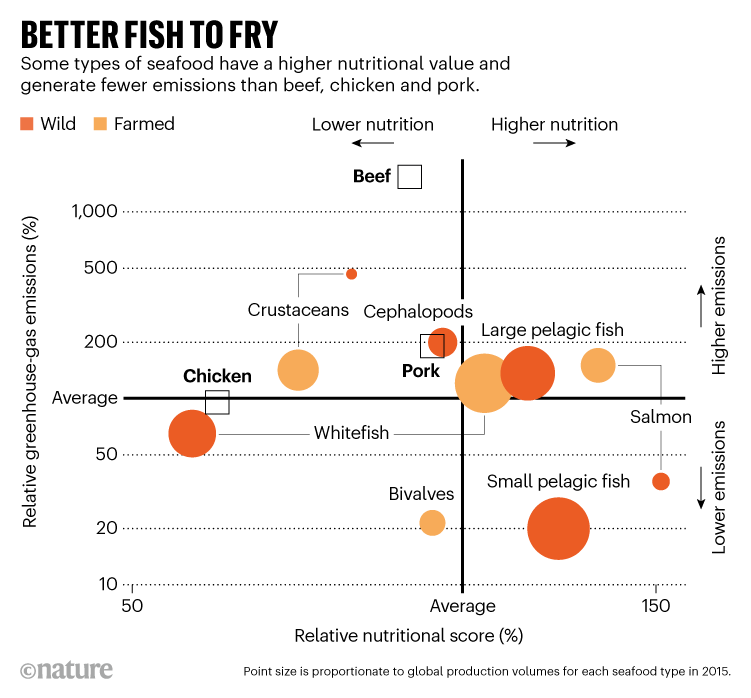
I am not convinced by this work, both the definition of nutritional "score" and environmental impact, but it is interesting anyway

d41586-022-02928-w_23480934.png

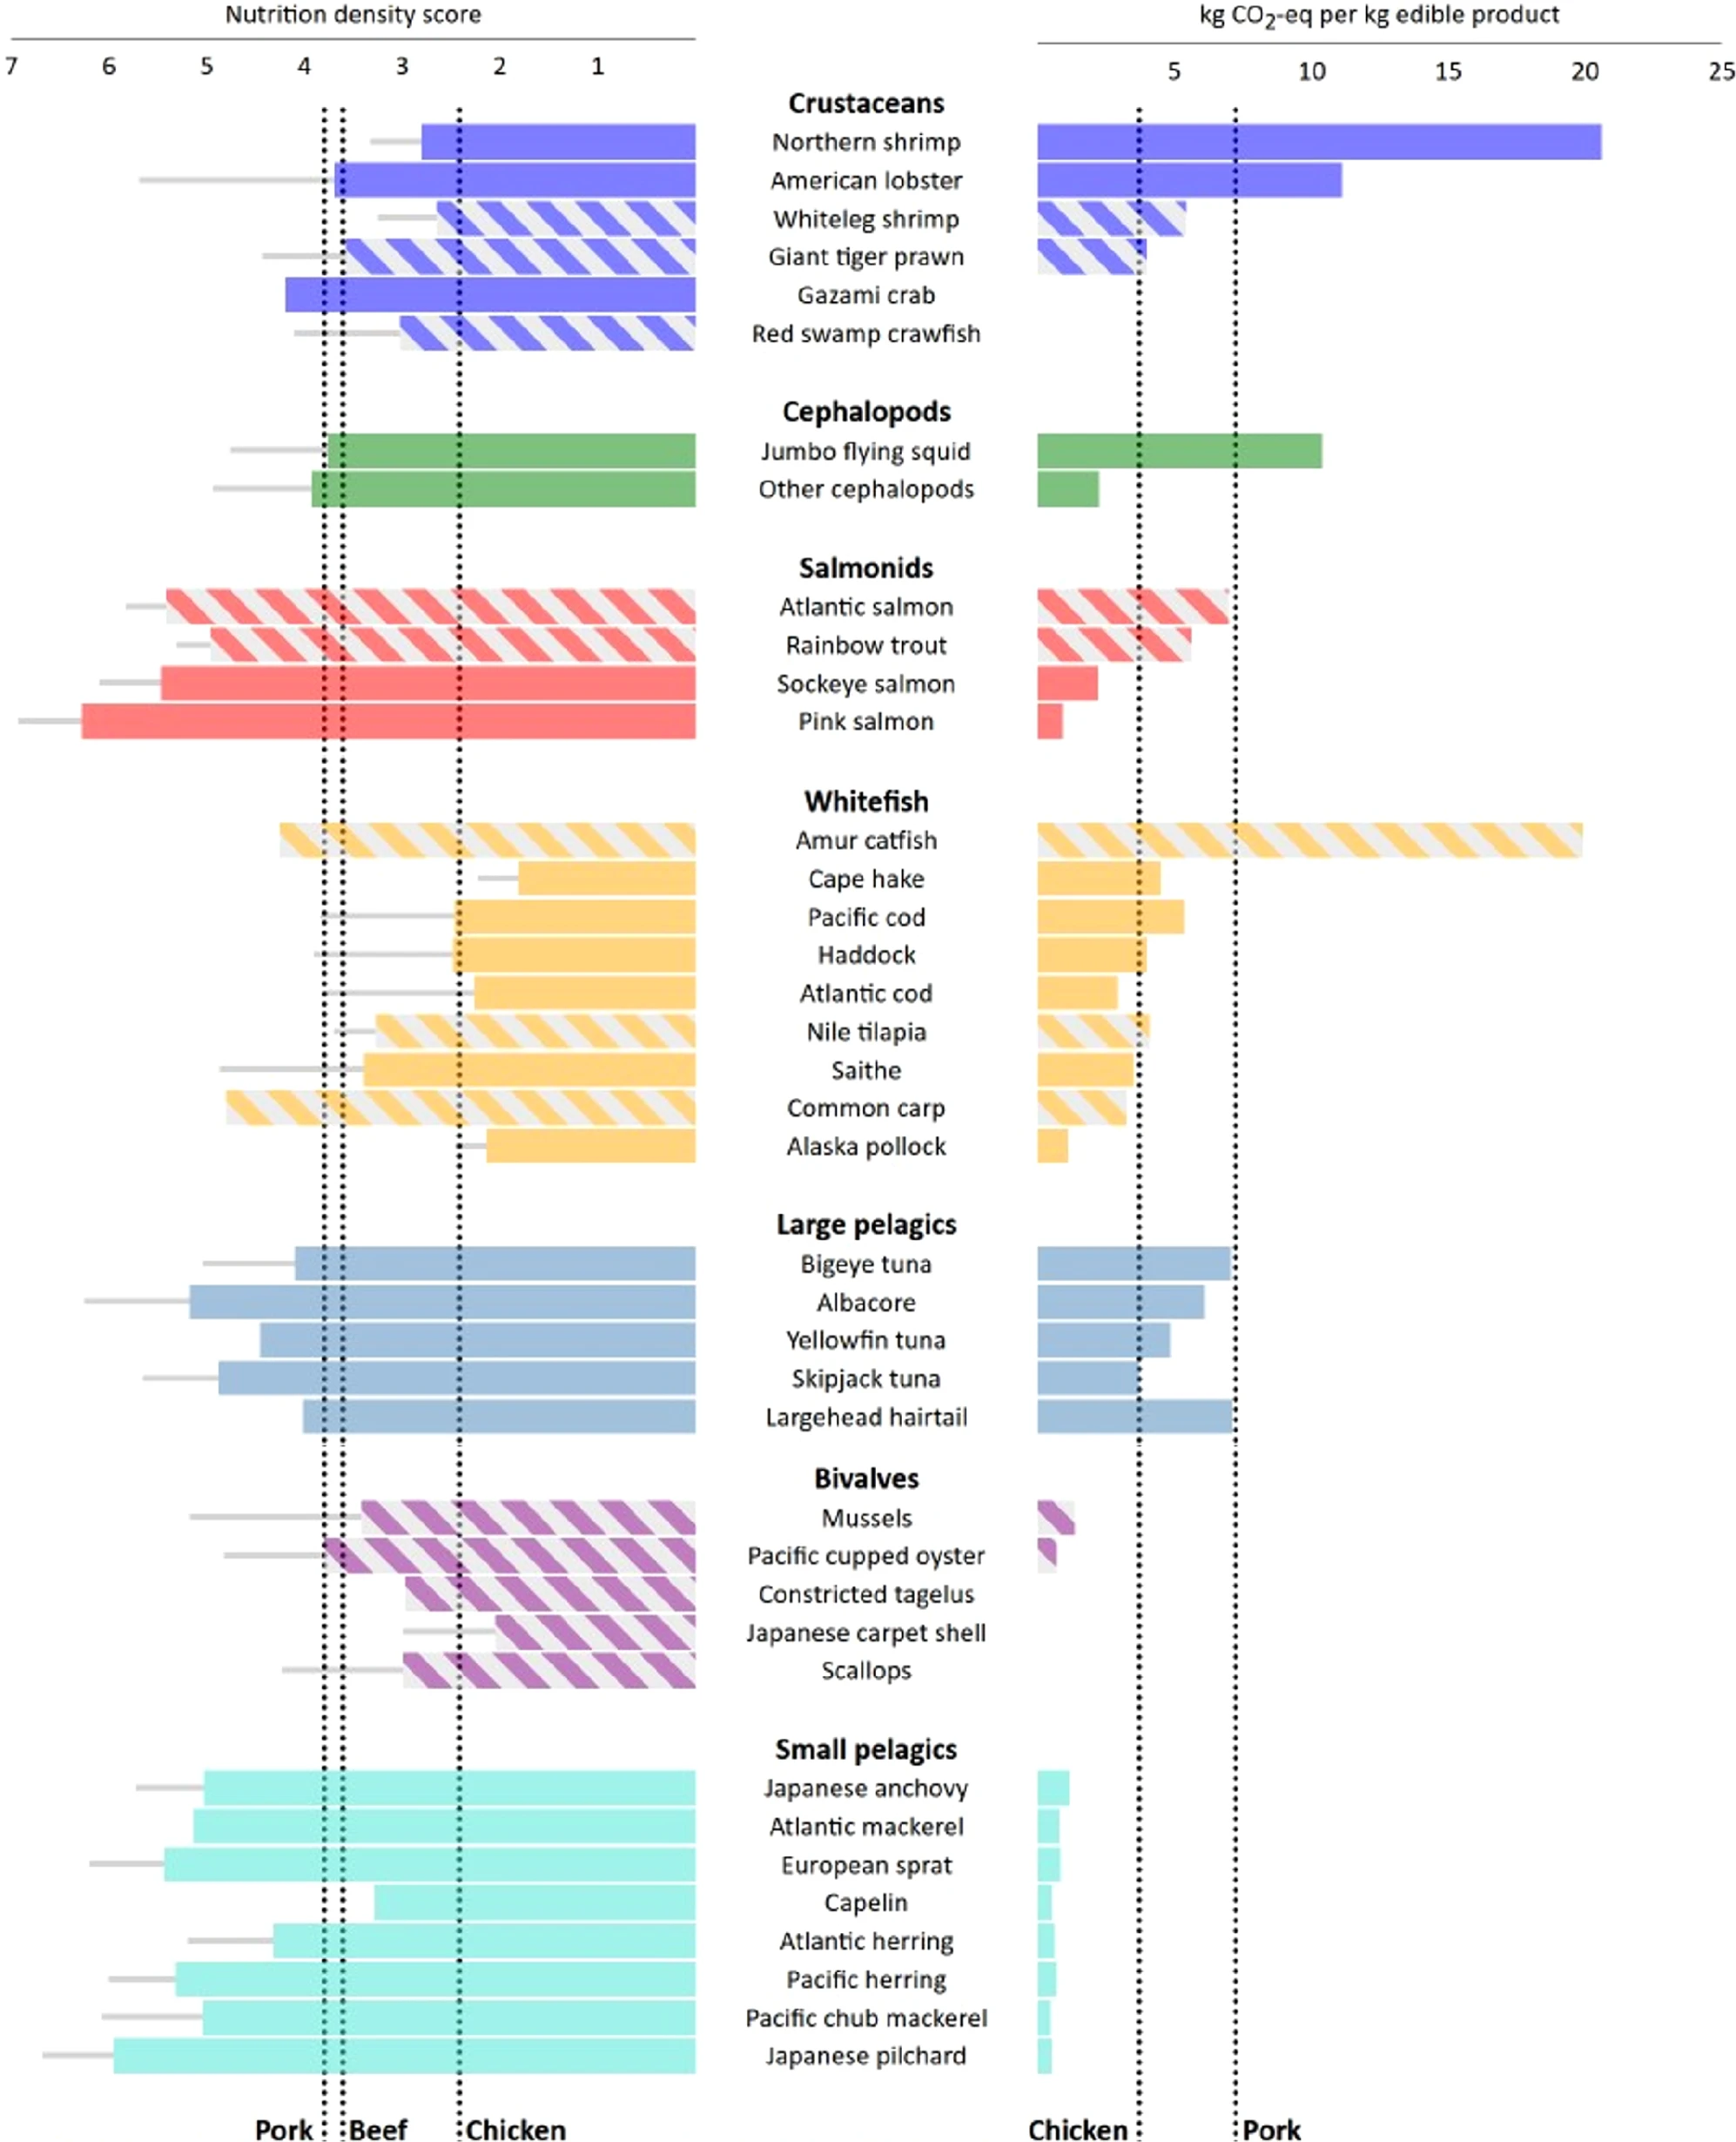
Spoiler More detail including what fish are in which class :
43247_2022_516_Fig2_HTML.png

Spoiler Legend :
Nutrient density scores are based on the 21 nutrients common to all species (full bars) and, where possible, 23 nutrients (grey lines) (for nutrients see Methods). GHG emissions of individual seafood species are representative of the dominant production method for each (or weighted if multiple major production method is employed globally). Solid bars indicate species from fisheries, and striped bars species from aquaculture. Comparisons to land-based animal proteins are based on nutritional content of averaged meat cuts for beef and pork, and fillets for chicken. GHG emissions of beef are beyond the scale at 56 kg CO2e per kg edible product.


Writeup Paper
 
d41586-022-02992-2_23514058.jpg

Spoiler More from the paper :
1-s2.0-S1352231020305689-gr3_lrg.jpg

1-s2.0-S1352231020305689-gr2_lrg.jpg

Spoiler Legend :
Data related to the growth of aviation traffic and CO2 emissions from 1940 to 2018. Panel (a): Global aviation CO2 emissions. Underlying fuel usage data for 1940 to 1970 are derived from Sausen and Schumann (2000) and for 1970–2016 from International Energy Agency (UKDS, 2016) data, which include international bunker fuels. For 2017/18, the values are scaled from information from the International Air Transport Association (see Appendix A). The average annual increase of global emissions from 1960 to 2018 is 15 Tg CO2 yr−1 and the corresponding decadal average growth rates are 8.0, 2.2, 3.0, 2.3 and 1.1% yr−1, yielding an overall average of 3.3% yr−1. Panel (b): Global aviation traffic in RPK and ASK from airlines.org (http://airlines.org/dataset/world-airlines-traffic-and-capacity/), and the transport efficiency of global aviation in kg CO2 per RPK. The passenger load factor defined as RPK/ASK increased from about 60% in 1960 to 82% in 2018. Panel (c): Total anthropogenic CO2 emissions and the aviation fractions of this total with and without the inclusion of CO2 emissions from land use change (LUC) from the Global Carbon Budget 2018 (Le Quéré, 2018). Panel (d)–(f): Additional aviation emissions data by region and year. The yearly sums of OECD and non-OECD values in (d) equal the respective global total values. The regional values in (e) and (f) also sum to equal the yearly global total values. Note different vertical scales (http://www.oecd.org/about/membersandpartners/) (UKDS, 2016) (Country listings in SD Spreadsheet).

Spoiler Minor rant :
How can you have, in the same figure, the units of teragrams, gigatonnes and kilograms? Why not at least use the same base unit? Is it just to make it hard to compare?


Paper Writeup
 
That's how the Guardian put it too. We're both rapidly turning into poor countries, with some very rich people, most of whom are either in government or influencing it.
 
Are these charts or pretty tables?

hicbV.png
VRDg1.png

Spoiler What I do not get :
How do "good" universities in the US not produce good science? I have read loads of papers from MIT and Stanford, but never seen one from Princeton and I have never even heard of Harvey Mudd (was that not a baddy in Star Trek)
 
Australian politics in one image lol

aus pol.PNG
 
Incredible info here, apparently we as humans are just, in the aggregate, hardwired to think all proportions are either two thirds or one third.


perceptioopns.PNG
 
Pretty sure more than 3% are atheists but don't feel fully comfortable being out of the closet about it.

I would've guessed way under on household income above 100k
 
Incredible info here, apparently we as humans are just, in the aggregate, hardwired to think all proportions are either two thirds or one third.


View attachment 644262
You have to wonder about the methodology. How could anyone think that 61% of people have an income over $50k and 50% have an income over $25k? Only 11% in the "normal" 25-50k range?
 
That reminds me of the factoid that the majority of Americans think that foreign aid should be reduced to 10% of the government budget
 
Incredible info here, apparently we as humans are just, in the aggregate, hardwired to think all proportions are either two thirds or one third.


View attachment 644262

So... the US people really think that on average 1/3 of their population lives in New York city, and another 3rd lives in California?
I assume these questions were not asked together...

And how the heck do you get to 20% transgender? Do they realize that this would mean that every 5th person they know should be one? Do the people in the US not learn percentages in school? Same with 27% muslim, 30% jewish and 40% military veterans. (+ add the 58% Christian, making it a very interesting religious mix for some people...)
 
Incredible info here, apparently we as humans are just, in the aggregate, hardwired to think all proportions are either two thirds or one third.


View attachment 644262
Percent making 100k: 30%
Percent making a million: 20%

So two thirds of people making over a hundred are making over a million
 
In emissions terms, yes. Plus please note the non-linear scale on the y-axis. Seafood requires a few other considerations when trying to purchase the most ethical choice. The sustainability of the fishing style and the human conditions on boat are very large factors.

My favorite ethical meat is mussels (though I was close to the coast, so YMMV). The ratio of diesel : protein is very reasonable, and mussel farmers are somewhat canaries in the coalmine for environmental issues. Even then you still have to source properly.
 
Back
Top Bottom