You are using an out of date browser. It may not display this or other websites correctly.
You should upgrade or use an alternative browser.
You should upgrade or use an alternative browser.
[RD] Daily Graphs and Charts II: Another 10,000 to come.
- Thread starter Cutlass
- Start date

The latter makes more sense if you consider that there's mostly no other good way to get anywhere in Norway. Apparently half of the 10 busiest air routes in Europe are within Norway, due to the same reasons (although I'd need to check again to back this up).
Those numbers are a bit stunted due to general travel restrictions and limited travel.
A lot of those figures can be easy to argue, say by picking particular airports.
Tomorrow, Saturday there are seven flights to Copenhagen from Oslo, but there are probably a couple more from the cheaper airport an hour away.
From Dublin there will be 31 flights to London, but they are spread between the 5 London airports so won't show up as much on a pairing.
Paul in Saudi
Emperor

Bubble chart of wars over 99900 deaths. There are a lot (7?) of Chinese civil wars on this chart.
Spoiler Are these all Chinese civil wars? :
Last edited:
Yeah, that and being an entity for ~3000 years.There are just a lot of Chinese.
You'll not find an Andorran or Luxembourgian civil war on that scale.

GinandTonic
Saphire w/ Schweps + Lime
- Joined
- May 25, 2005
- Messages
- 8,898
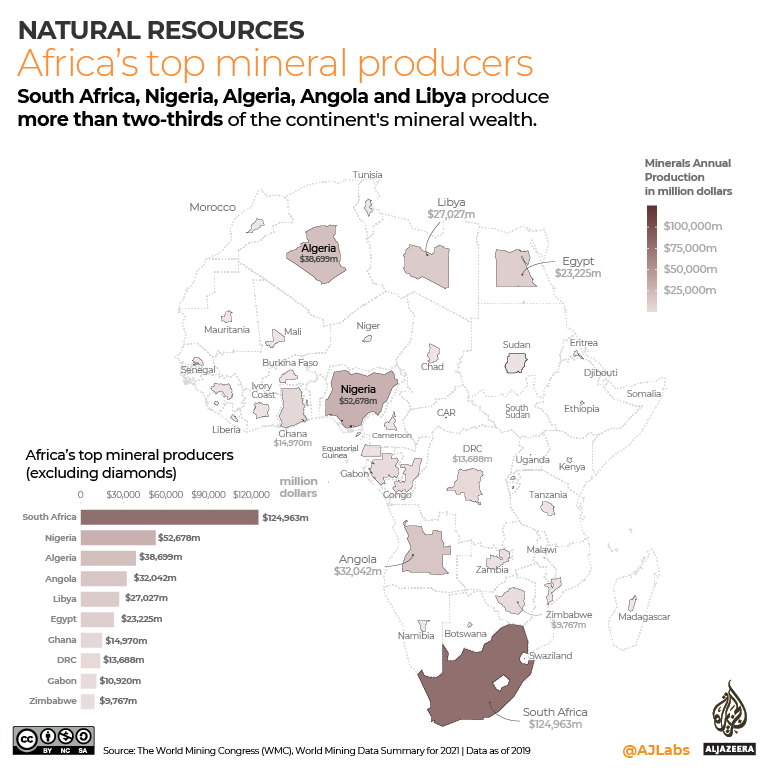
What's up with France?
Samez
Emperor
- Joined
- Jan 31, 2005
- Messages
- 1,643
Canada, Iceland and Norway are also known to have energy intensive industries like aluminium and other arc furnace processes (e.g. Acheson). They do have those industries due to cheap power beeing available due to plenty of hydroelectric power generation.
IIRC Iceland has also switched ist's ships from Diesel to hydrogen.
IIRC Iceland has also switched ist's ships from Diesel to hydrogen.
JohannaK
Heroically Clueless
I suppose with SK shipbuilding is probably a very energy-intensive industryI'd rather ask what's up with South Korea...?
For the top scorers, I guess the excess consumption is due to heating/cooling with electricity... ?
stfoskey12
Emperor of Foskania
Lots of states lost population from July 2020 to July 2021. For comparison, from 2010 to 2020, only West Virginia, Mississippi, and Illinois lost population.

World bank has a page for the world population change for 2020, they kind of go out of their way to stop you getting a good image and I cannot be bothered to make my own, but below is a screenshot. The US as a whole is 0.4, about a third of the way up. Moldova at the bottom with -1.7 is not much of a surprise, but what is wrong with Curacao (second lowest at -1.6)?

I accidentally reverse image searched this, and google thinks it is "destinations royal air maroc".
I accidentally reverse image searched this, and google thinks it is "destinations royal air maroc".
Last edited:
Mapping Methane Emissions from Fossil Fuel Exploitation
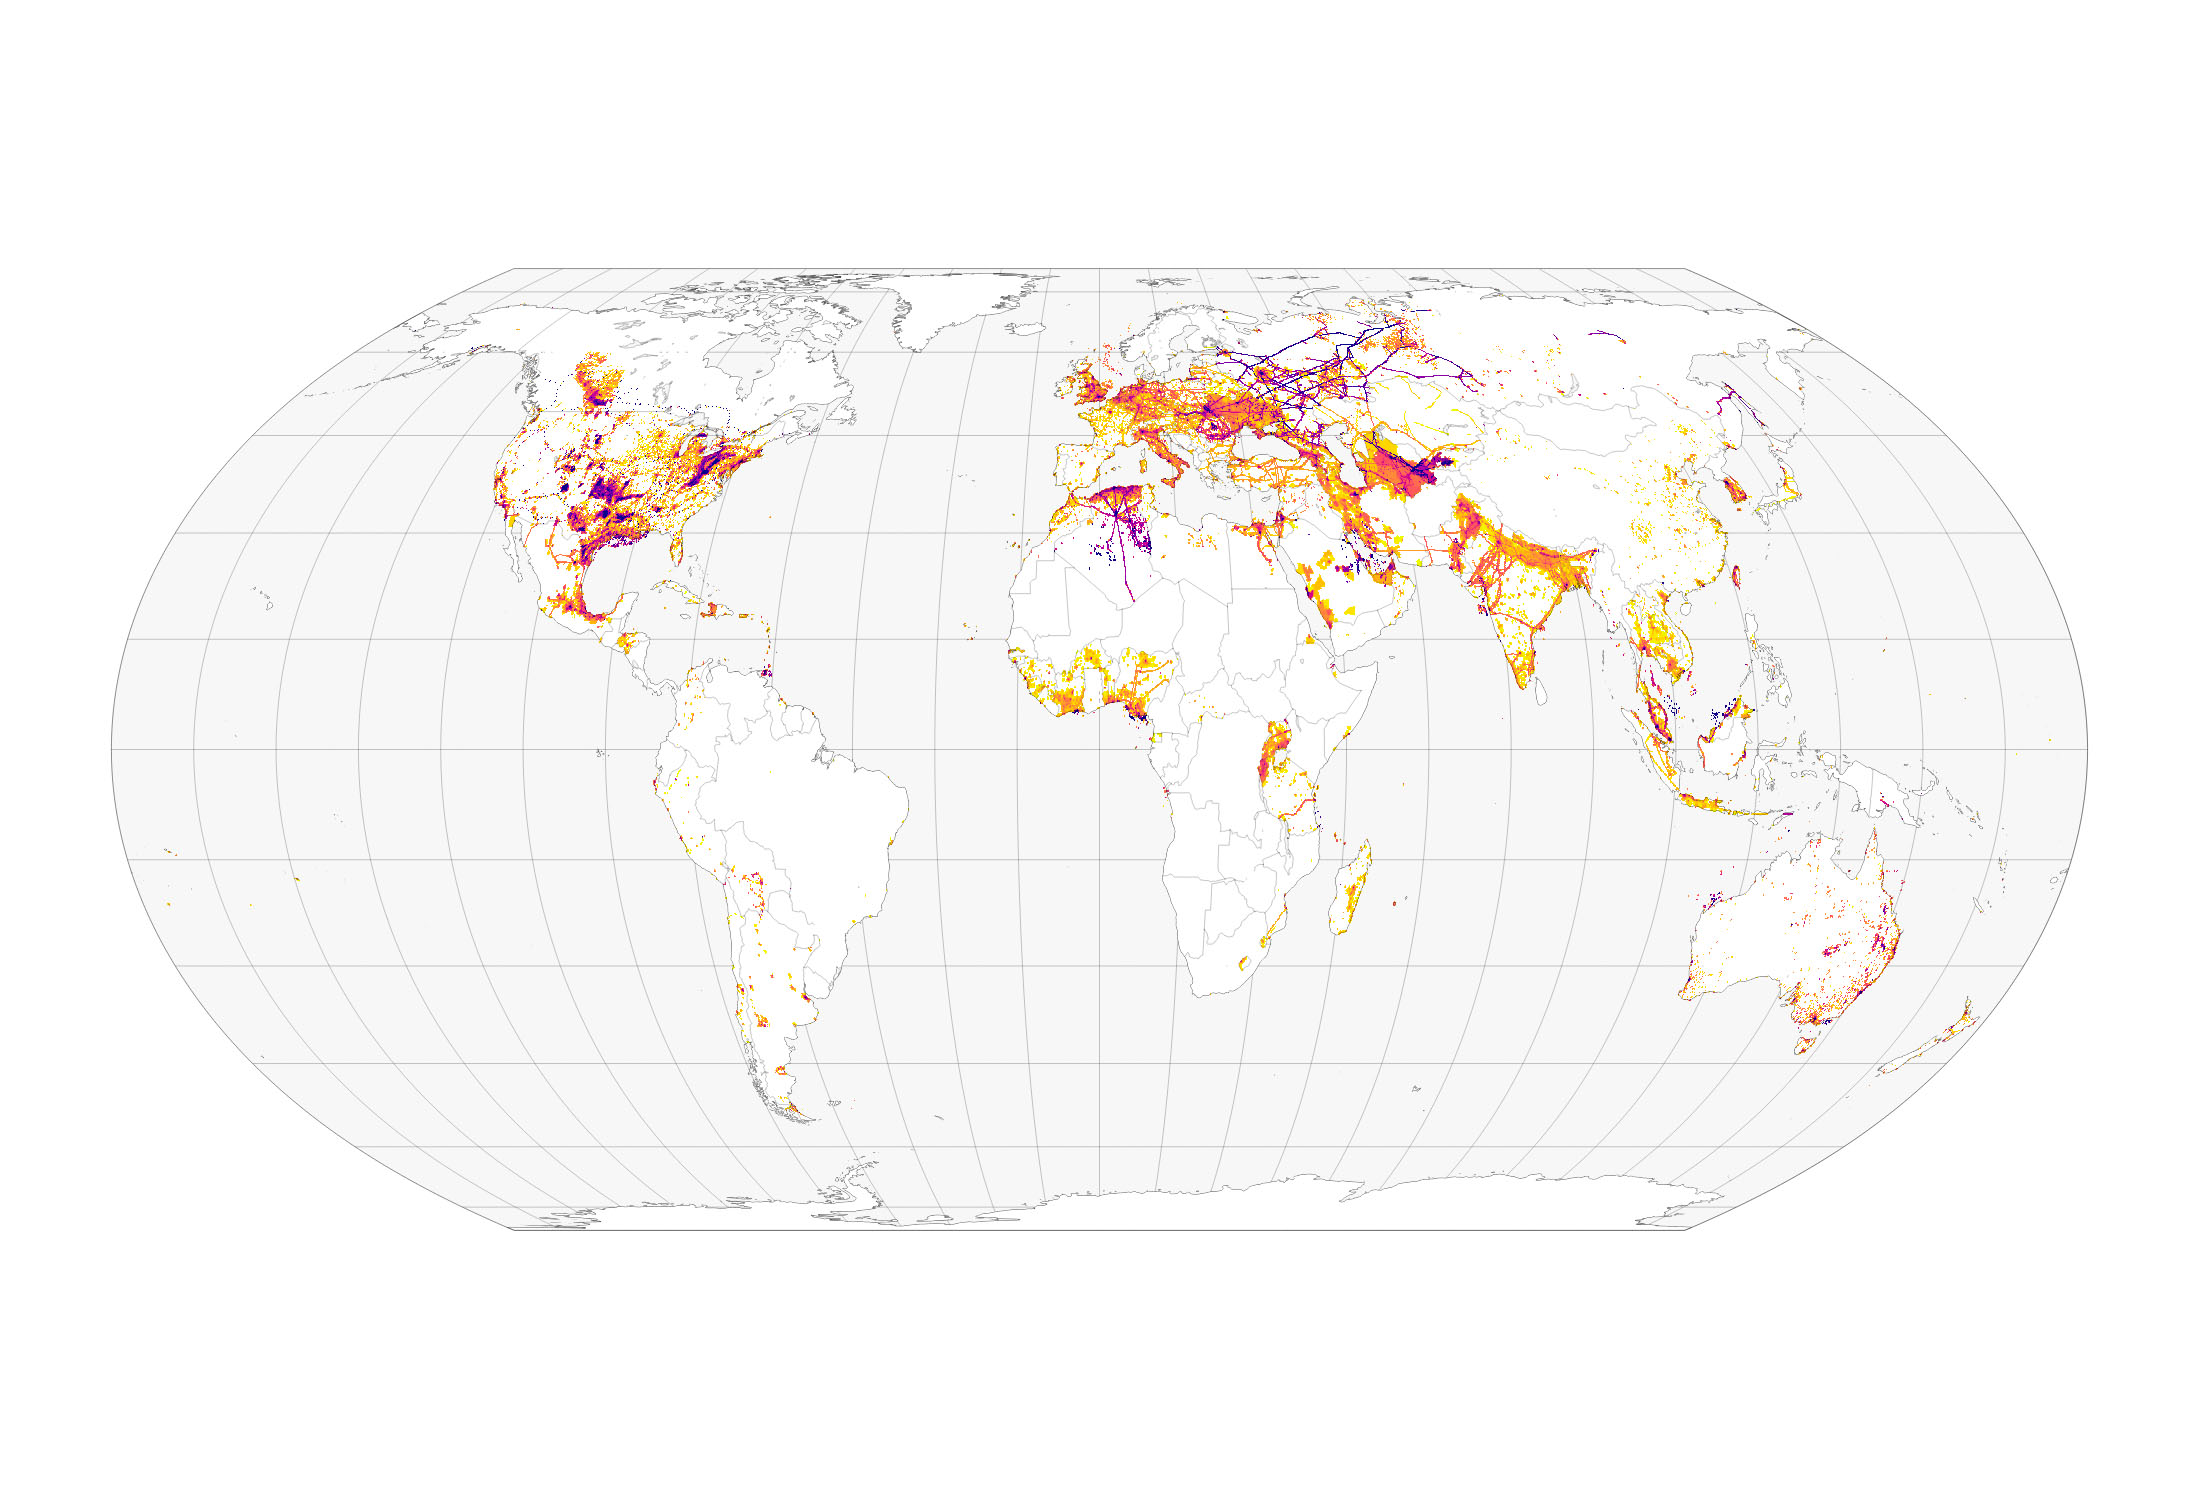
The amount of methane in Earth’s atmosphere has reached record levels in recent years. One of the major sources of emissions is the extraction, storage, and transportation of oil, natural gas, and coal, which results in the release of about 97 million metric tons of methane gas each year, according to the United Nations (U.N.). In a recent research project, scientists mapped where those emissions are coming from—not just by nations, but within them.
The amount of methane in Earth’s atmosphere has reached record levels in recent years. One of the major sources of emissions is the extraction, storage, and transportation of oil, natural gas, and coal, which results in the release of about 97 million metric tons of methane gas each year, according to the United Nations (U.N.). In a recent research project, scientists mapped where those emissions are coming from—not just by nations, but within them.


Similar threads
- Replies
- 4
- Views
- 288
- Replies
- 128
- Views
- 13K
- Replies
- 292
- Views
- 16K