[RD] Daily Graphs and Charts

Status
Not open for further replies.
warpus said:
1269-14337752701765648255.png
Borachio said:
According to the 2006 census (I'm keen, aren't I?), there were 36,000 Muslims in NZ.

So:

36,000 Muslims in New Zealand, of which 6 joined ISIS.

30,000 Muslims in Poland, of which 0 (zero) joined ISIS. :D
 
That you know of... What must the margin of error be on an estimate like this? When you're talking about six people?
 
Source
Spring - slightly better than chance
pc_mam101112_temp.gif


Summer - worse than chance
pc_jja101112_temp.gif


Autumn - slightly better than chance
pc_son101112_temp.gif


Winter - worse than chance
pc_djf101112_temp.gif


Overall the prediction of climate is no better than chance. :goodjob:
 
Why are you happy about that? What the bloody hell is wrong with you?

Also, I'm quite sure there's more to climate modelling than predicting temperature anomalies.
 
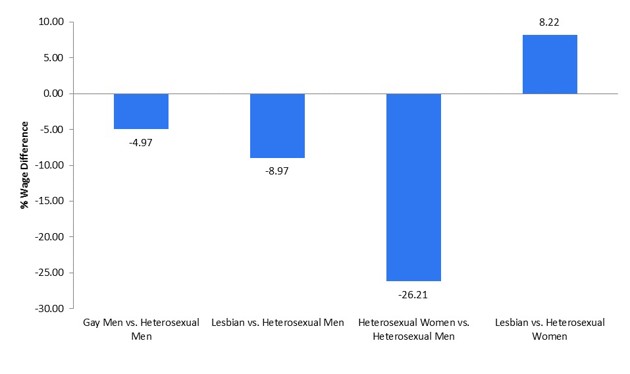
Homosexual women earn more than heterosexual women. Curious about the reason.
87e72f826.jpg

"Waite and Denier | Data: 2006 Census of Canada"
 
Gah.
 
What variables did you have in mind? Might be that they've already controlled for it.
 
What variables did you have in mind? Might be that they've already controlled for it.

I'm just guessing, but it is very likely that homosexual women pursue slightly different jobs and careers from heterosexual women.

Restrict the data to specific jobs, full-time vs part-time, etc. and the discrepancy should all but disappear. It's a guess, but this is what happens with strict male vs female wage data. (wage gap disappears to within 3% or so)
 
Restrict the data to specific jobs, full-time vs part-time, etc. and the discrepancy should all but disappear. It's a guess, but this is what happens with strict male vs female wage data. (wage gap disappears to within 3% or so)

I am sure you are right (I suspect controlling for number of children would go a long way) but that is saying why the gap exists not if the gap exists.
 
I am sure you are right (I suspect controlling for number of children would go a long way) but that is saying why the gap exists not if the gap exists.

The "wage gap" is an implication that one group makes more than the other, given the same jobs. To most people looking at the above graph, they will assume the same thing. I am just saying that the graph we're given likely doesn't control for those variables - so it is slightly deceiving for that reason.

A pure guess on my part, I admit, as I have no idea how they collected that data. I would just be surprised that homosexual women make more than heterosexual women - at the exact same jobs. Such a high discrepancy is likely caused by looking at hard numbers and not doing a proper analysis, unless you do in fact have some sort of a systematic effort by society/the state/whoever to discriminate against heterosexual women wrt homosexual women. I would be surprised if that were the case other than on an anecdotal here-and-there type level. (edit: and going in the other direction)
 
I love Bond, but this is plain obsessive. :p
 
I would just be surprised that homosexual women make more than heterosexual women - at the exact same jobs.

While you're most likely right about all the rest (that the statistics were just wrong), I'd not be suprised about this part.
I'd assume that an openly homosexual woman is more used to stand up for what she deservers than a heterosexual woman, and therefore is probably more active if it comes to discussions about salary. First part might (not sure) also apply for homosexual men, but there you have the problem that they might not want to engage with the average boss (which is a heterosexual man) in the same manner.
But these are also generalizations, and would probably only have an effect in the per mille area, and not as much as reported in these graphs. As said, you're most likely right about that.
 
Status
Not open for further replies.
Back
Top Bottom