Lexicus
Deity
But that was such a radical variation around the mean that it was (AFAIK) more impactful than the current shift.
What the changing mean....means, is that such radical variations become considerably more likely.
But that was such a radical variation around the mean that it was (AFAIK) more impactful than the current shift.
Not really.
To make a statement about such events, you need a statement about the new variance. i.e., is the variance fatter or slimmer as things shift to the new mean?
Such research is simply another way of identifying the impacts of climate change. None of it should be a surprise. Researchers have repeatedly warned that the US climate is changing with ever-greater risks of climate extremes, including ever-more devastating droughts, and with increasing risks of forest fire.
The authors conclude: “Ultimately, the consistency of our results suggests an exceptionally high risk of a multidecadal megadrought occurring over the Central Plains and Southwest regions during the late 21st century, a level of aridity exceeding even the persistent megadroughts that characterised the Medieval era.”
I disagree that the dust bowl wasn't worse. I don't see people moving to California by the hundreds of thousands just so they can eke out a living.
")
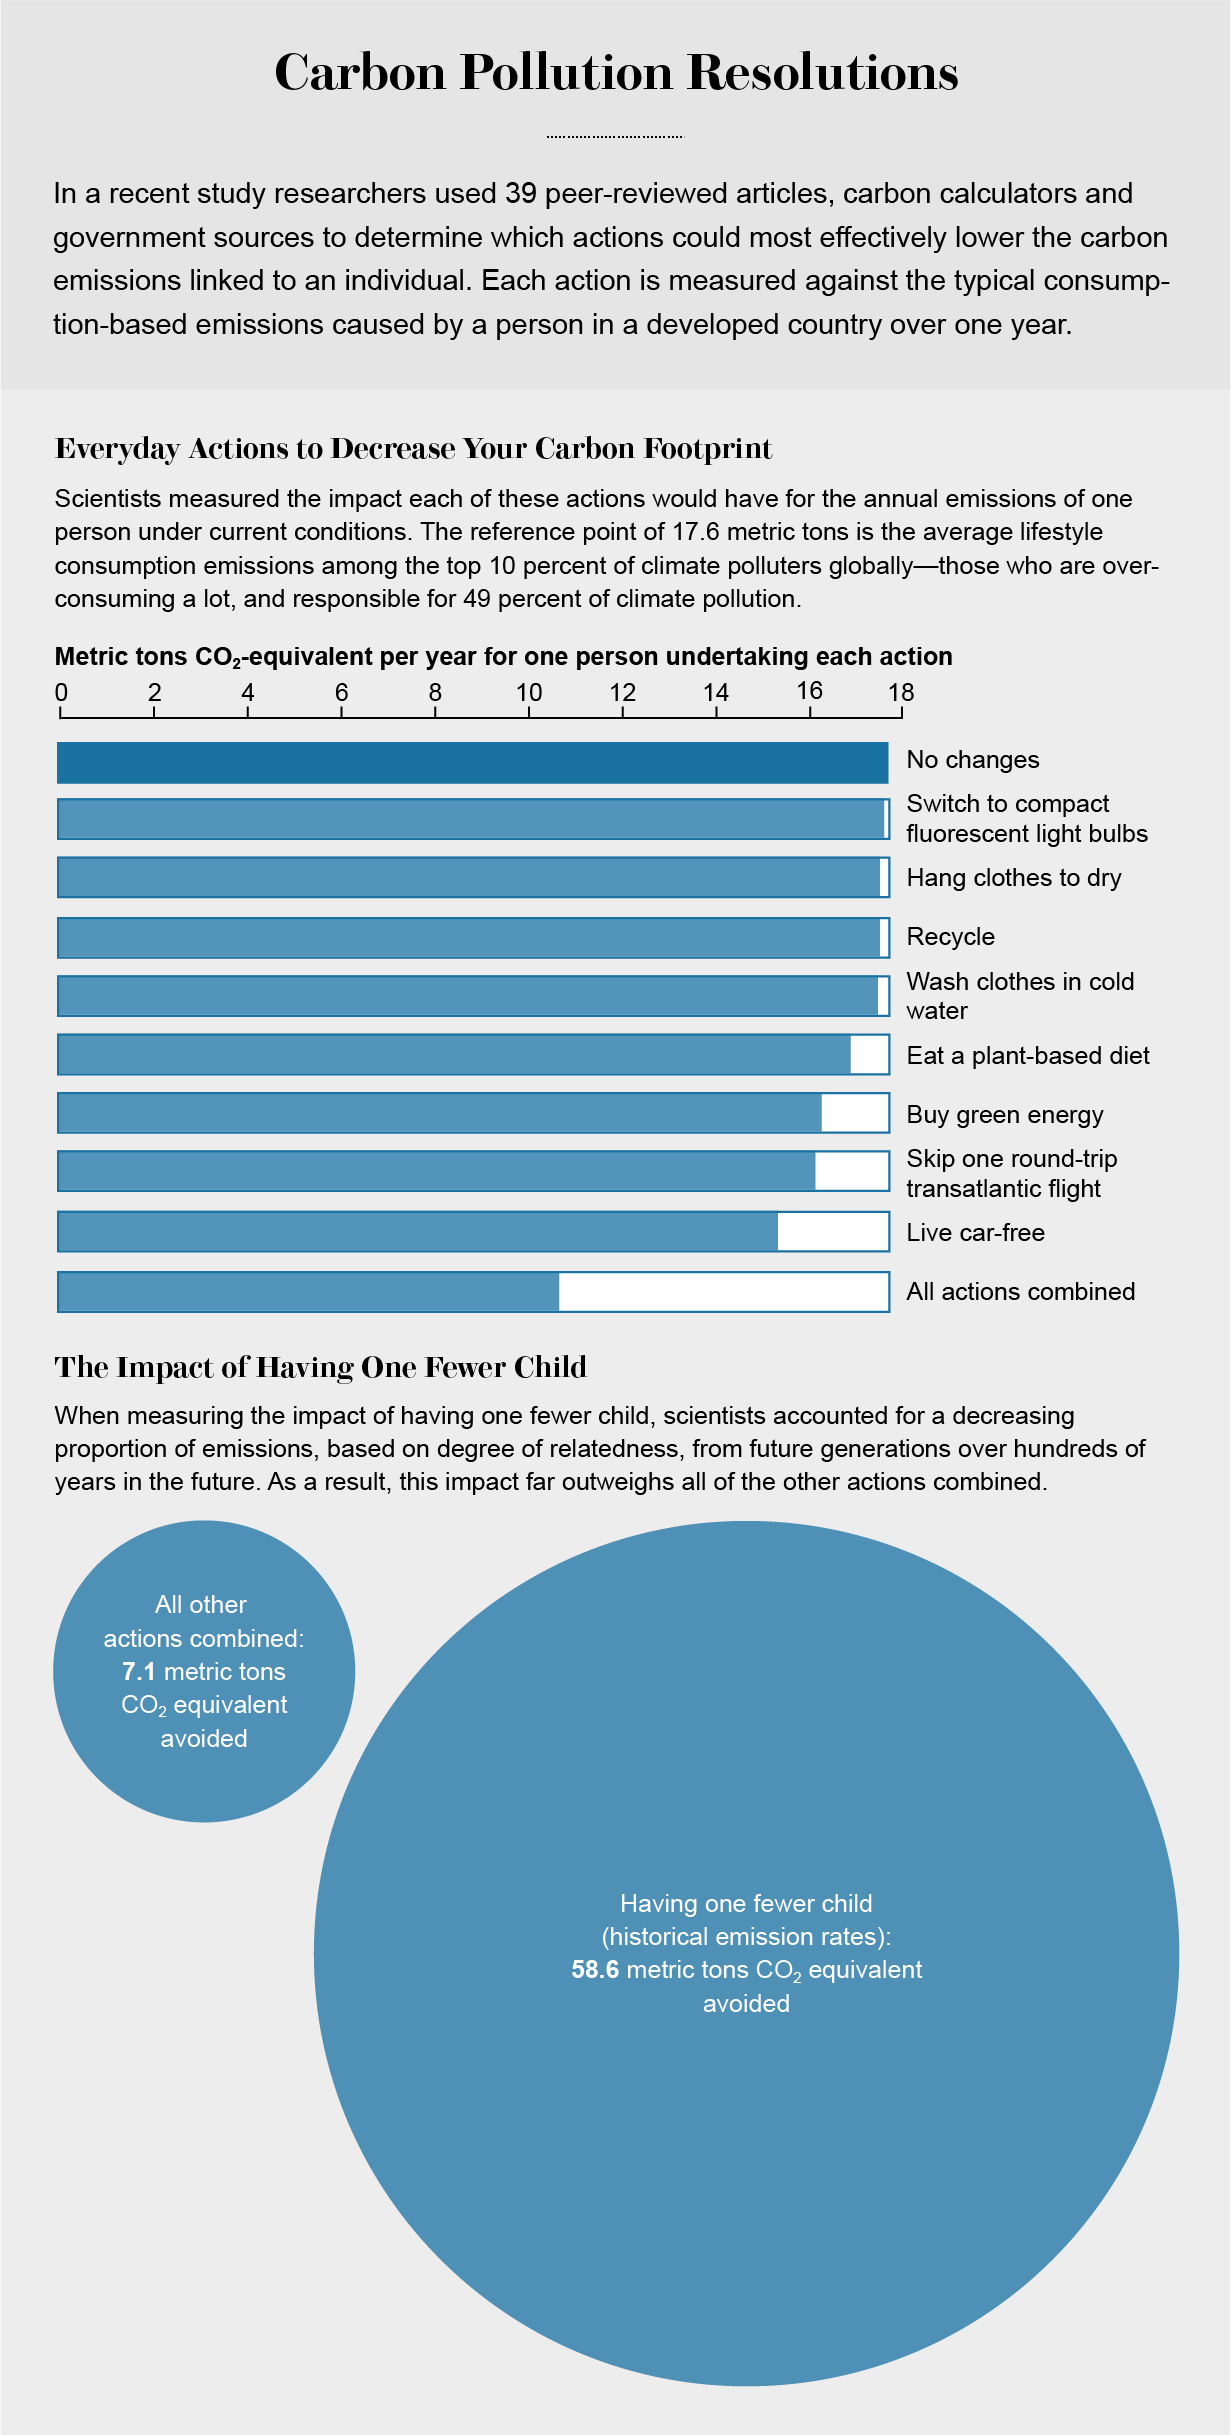
I wonder what they mean by "Buy green energy"? It does not sound as drastic as those around it such as "Live car free" and "Eat a plant based diet".
I looked it up and it is what you can get from current suppliers, It also has this graph, that shows that in the UK we cannot make much saving.They mean, I assume, getting more or all of your electricity from renewables.

From the link hobbs posted originally on this:
Clicking on the drought link gives
https://climatenewsnetwork.net/arid-areas-us-face-prospect-megadroughts/
https://blogs.scientificamerican.co...utm_term=sustainability_news_infographic_free
@Plotinus reason #47839241 for anti-natalism
I tried to stop because I realized I had successfully pulled a bait-and-switch on word usage, without meaning to. You were talking about the mean rain averages in the rain shadow. I was talking about the statistical bell curve over the whole. The rain shadow is best looked like a shift in local effects, and the statistical average over the whole of oklahoma could very easily not capture that. And increasing variance in rainfall over the *whole* wouldn't be the right tool anyway. If rain is being concentrated in one region over another, that would bring down the variance in the averages in a reasonable number of the models anyway. Apologies.From the link hobbs posted originally on this:
Clicking on the drought link gives
https://climatenewsnetwork.net/arid-areas-us-face-prospect-megadroughts/
I do agree with you that this metric is the most fair, but probably not the most useful.I generally talk about 'per capita emissions', because I happen to think that apportioning the atmospheric budget in a per capita way is basically the fairest I can think of. And I start the timeline at "1992" (because that's when the Rio Conference was agreed to) or at least "1992" because that's when Kyoto was signed.
Everyone and their dog knows that we currently need to emit fossil carbon as part of the process of lifting our people out of poverty AND creating the alternatives. But this is for the "what about China???" people. The Chinese are consuming their share of the buffer vastly slowly than my countrymen are.
I'm not denying it won't be bad in 70 or 80 years, I'm just saying it's currently less bad than the dust bowl was. I generally try to take all claims about future climatic changes in a smallish region like that with a grain of salt. Sure, it could be horrible. Or maybe not. We probably won't know for sure until it's too late to do anything about it.
Ehhh, I still want to be a dad some day.
A lot of EU countries have also improved immensely their energy efficiency and they are already hitting the law of diminishing returns, whicle in countries like China and even more India, it's easier to get large efficiency gains.
True. It's designed mostly to show how "they are not doing their share" is a false argument. It will be a long time (maybe even never) before the average Chinese person is as bad as the average Canadian. There are many different ways to frame the problem, I created that graph in order to help counter a spin in framing that allows people to do nothing "because the Chinese are the problem".
Is driving a cleaner car not a lifestyle change?