Are there no christians in Chad, or is the meme real?A map of where Christians face the most persecution. I know this might be shocking for some conservative Christians here, but the USA doesn't crack the top 50!
View attachment 658556
Chart of where Christianity is growing fastest.
View attachment 658557
You are using an out of date browser. It may not display this or other websites correctly.
You should upgrade or use an alternative browser.
You should upgrade or use an alternative browser.
[RD] Daily Graphs and Charts II: Another 10,000 to come.
- Thread starter Cutlass
- Start date
People whose credit rating is "Deep Subprime" spend about as much on cars as those who are "Super Prime", and people in the middle spend more.
Also people who borrow to buy cars spend loads on cars.


Also people who borrow to buy cars spend loads on cars.
Spoiler And they pay a lot of interest :
Last edited:

Narz
keeping it real
And don't forget the acidifying oceans, plummeting sperms counts & microplastics in every nook & cranny.
It's hard to be optimistic enough to believe that buying up some semi-virigin land w access to water, arable land & protected from the teaming masses who are gonna inherit the consequences of humanity's shortsightedness and corruption isn't the best option (for those of us w kids, if you don't have kids, f-it, go be on the front line trying to help everyone)
Hopefully the reproductive harm we're doing to ourselves can help mitigate population growth enough to help us avoid the worst altho then we have the problem of too many old people depending on the young to support them (when human beings are having enough trouble trying to computer w technology & cheaper laboring human beings).
There are always those that say, "well humans always adapt" and yeah, so far, but @ what cost? Also how many humans. IIRC Rome's population went from a million to 10,000 or so over a few hundred years.
Anyway, enough doom, still gotta go about my day!
You really should go to the interactive webpage that I have screenshotted.
Women’s health research lacks funding – these charts show how
Diseases that effect one sex more, ordered by total disease burden in DALYs, coloured by if they affect men or women more

Those same diseases ordered by NIH funding, we see the big mostly women's disease dropping down the list. Who would have guessed AIDS and drug abuse were overfunded relative to burden?


Women’s health research lacks funding – these charts show how
Diseases that effect one sex more, ordered by total disease burden in DALYs, coloured by if they affect men or women more
Those same diseases ordered by NIH funding, we see the big mostly women's disease dropping down the list. Who would have guessed AIDS and drug abuse were overfunded relative to burden?
Spoiler Legend :
Spoiler ME/CFS is right at the bottom of the funding list :
The degree of underfunding or overfunding is different for the groups of conditions, too. On average, female-dominant diseases that are underfunded are more severely so. For chronic fatigue syndrome, also known as myalgic encephalomyelitis (ME/CFS), for example, the ratio of burden to funding is 0.04. For HIV/AIDS, the ratio is 15.6.
Last edited:
Akka
Moody old mage.
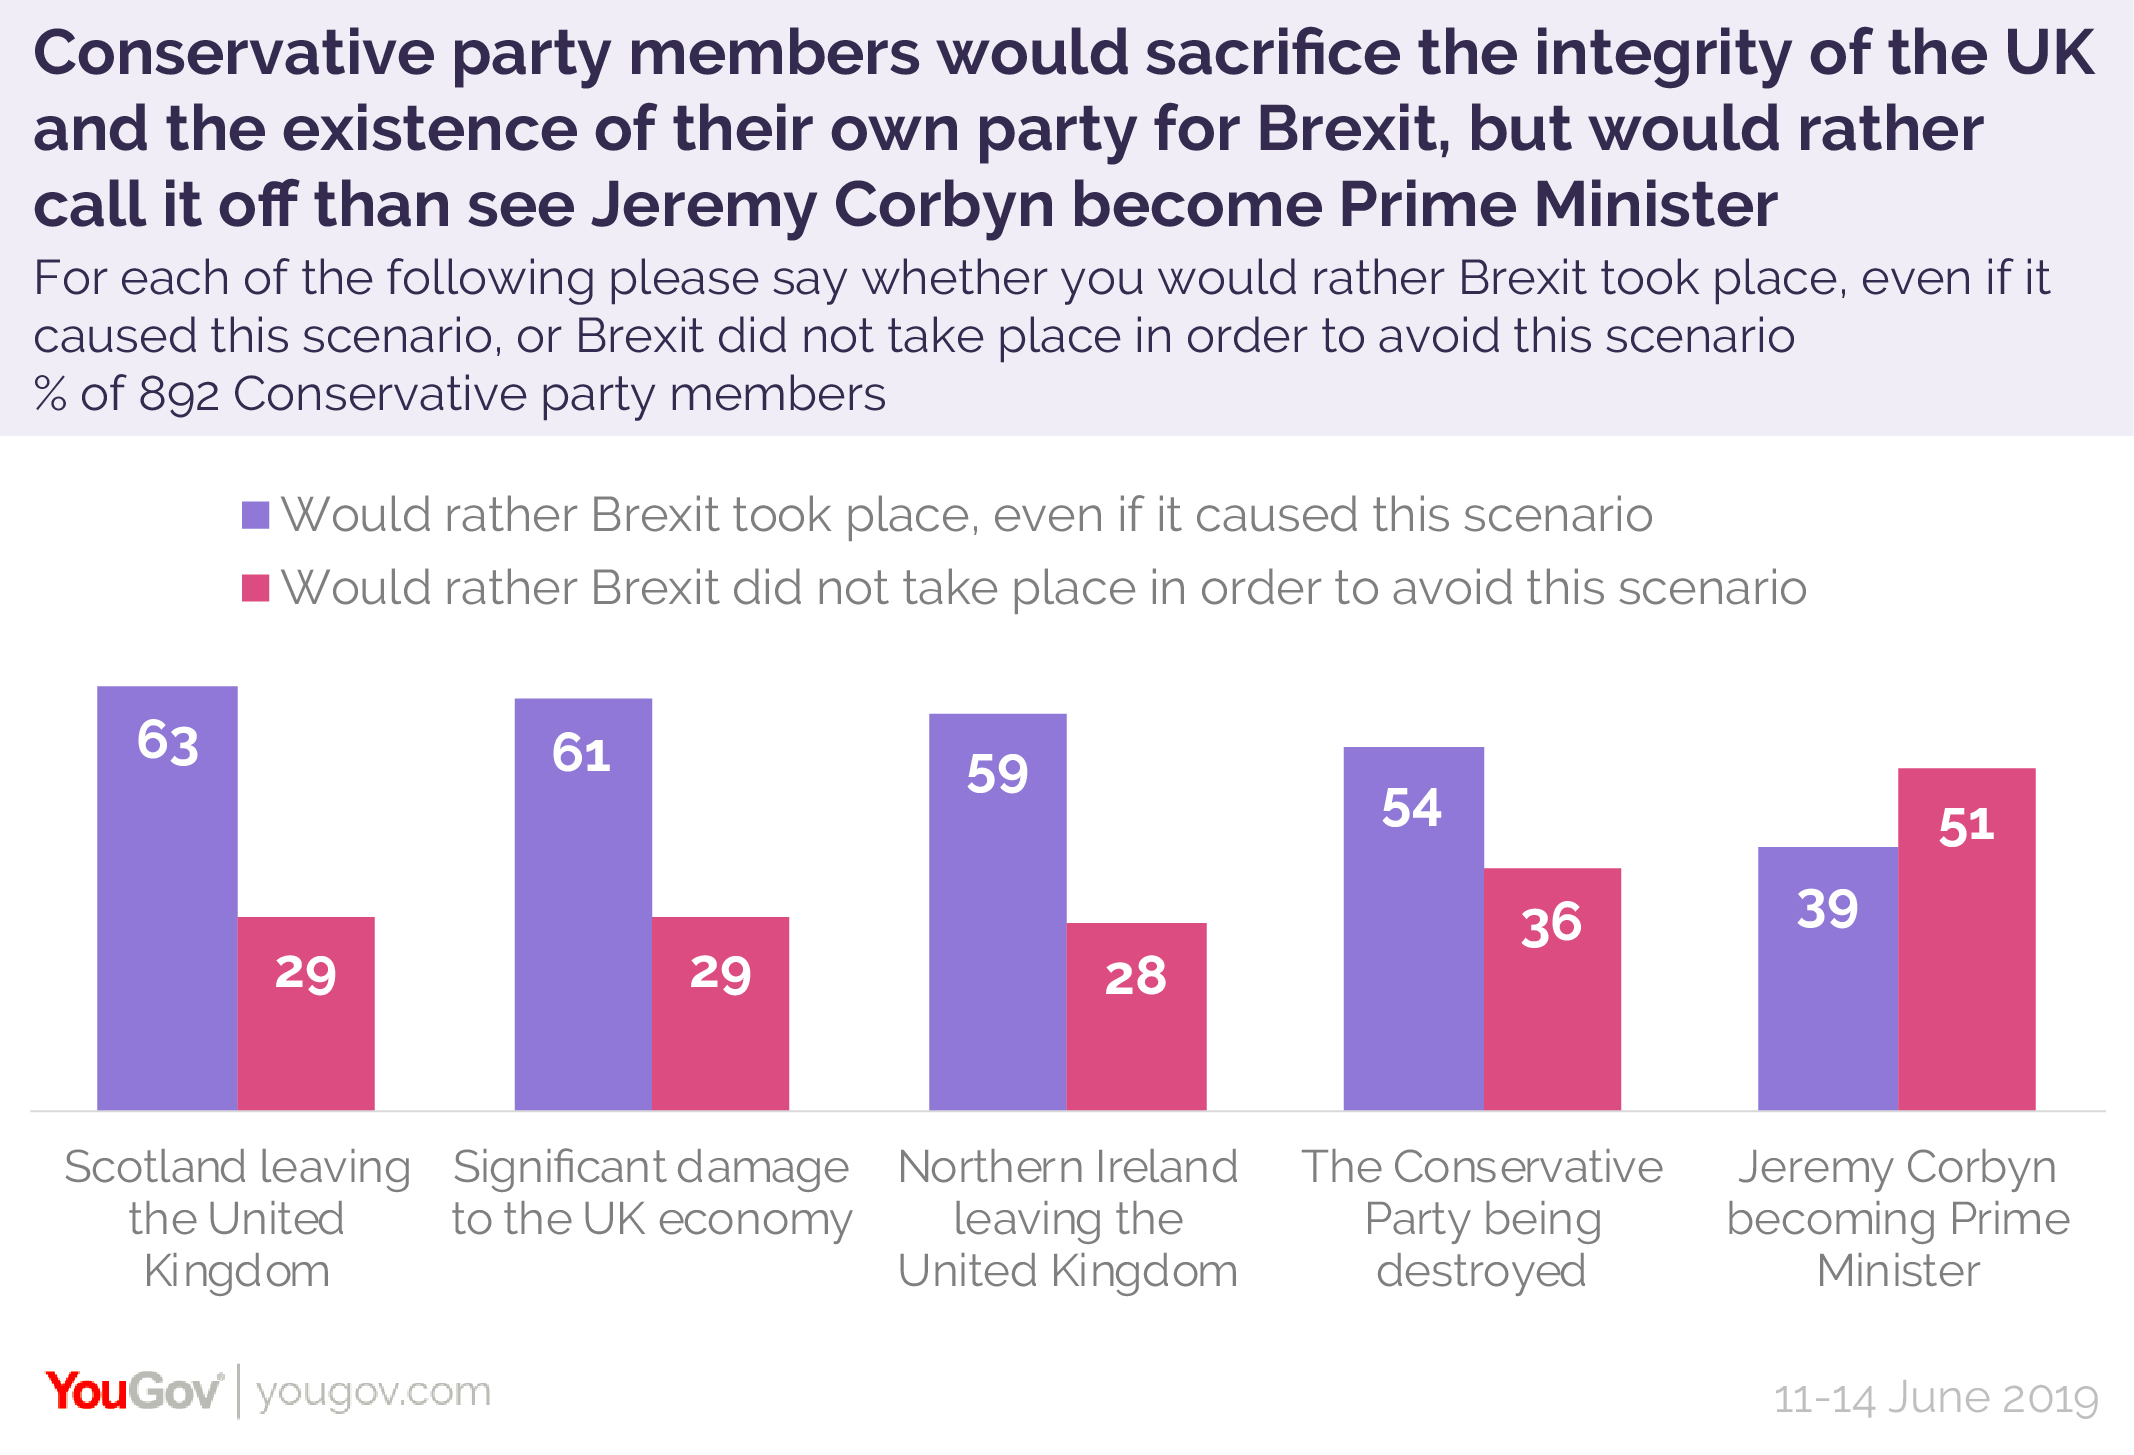
I think this is interesting in what it says about the tory party MEMBERS think about democracy, when having the leader of the opposing party winning is so much worse than damage to the country.

Yeah, I really can't find of anything else to say or add.
Please tell me it's a satirical piece or something.
")
The people who join political parties tend to be the most vocal and/or motivated. June 2019 was still before the disastrous tenures of Johnson and Truss, before we actually left the EU and before Covid.
Brexit still seems to be an article of faith for party members, but there are clear signs that its hold on "ordinary" politics in the UK is lessening (or, at the very least, that everything is sufficiently messed up for Brexit itself to be a minor consideration, if at all).
Brexit still seems to be an article of faith for party members, but there are clear signs that its hold on "ordinary" politics in the UK is lessening (or, at the very least, that everything is sufficiently messed up for Brexit itself to be a minor consideration, if at all).
For me the message it not the strength of feeling for Brexit, it is the relative strength with they hold these different negative consequences:The people who join political parties tend to be the most vocal and/or motivated. June 2019 was still before the disastrous tenures of Johnson and Truss, before we actually left the EU and before Covid.
Brexit still seems to be an article of faith for party members, but there are clear signs that its hold on "ordinary" politics in the UK is lessening (or, at the very least, that everything is sufficiently messed up for Brexit itself to be a minor consideration, if at all).
- The breakup of the UK, when "Unionist" is in the name of the Conservative and Unionist Party
- The economy being damaged, when their whole brand is based on being a bit evil but good for the economy
- The leader of the opposition getting into number 10, a possibility which is required to be possible for democracy to work
Last edited:
Local elections happening in Northern Ireland today. Probably nothing interesting to come from it unless there are big swings between the Unionist parties, which seems unlikely.
It was hard to avoid the Sussexes when it was billed as breaking news.
It was hard to avoid the Sussexes when it was billed as breaking news.
Akka
Moody old mage.
Being vocal/motivated is something I can understand. Conservative nationalists wishing for Brexit is something understandable too.The people who join political parties tend to be the most vocal and/or motivated. June 2019 was still before the disastrous tenures of Johnson and Truss, before we actually left the EU and before Covid.
Brexit still seems to be an article of faith for party members, but there are clear signs that its hold on "ordinary" politics in the UK is lessening (or, at the very least, that everything is sufficiently messed up for Brexit itself to be a minor consideration, if at all).
What just doesn't compute is the priority order. It just... doesn't make sense.
Yeah, that.For me the message it not the strength of feeling for Brexit, it is the relative strength with they hold these different negative consequences:
- The breakup of the UK, when "Unionist" is in the name of the Conservative and Unionist Party
- The economy being damaged, when their whole brand is based on being a bit evil but good for the economy
- The leader of the opposition getting into number 10, a possibility with is required to be possible for democracy to work
I just don't understand how people think in the world anymore

I do not really understand these, but why is the one on the bottom the most common and I cannot figure out what the one on the top is?

Condorcet Efficiency under Spatial-Model Assumptions (relative dispersion = 1.0)

Condorcet Efficiency under Spatial-Model Assumptions (relative dispersion = 0.5)
Source
Condorcet Efficiency under Spatial-Model Assumptions (relative dispersion = 1.0)
Condorcet Efficiency under Spatial-Model Assumptions (relative dispersion = 0.5)
Source
EnglishEdward
Deity
Looked at the first link.
It seems rather a lot of work to say that all electoral systems are imperfect.
It seems rather a lot of work to say that all electoral systems are imperfect.
EnglishEdward
Deity
And I suppose that it gives them something to argue about and they think it adds to their mystique if we can not understand them.
Farm Boy
I hope you dance
- Joined
- Sep 8, 2010
- Messages
- 28,270
Well, what is anyone if not for a little bit of mystique?
A box of secondhand cotter pins, a dirty and ripped instruction manual, a clever pivot chart in excel. Everything is available, including noise. You just gotta know what you're looking at, right?")
A box of secondhand cotter pins, a dirty and ripped instruction manual, a clever pivot chart in excel. Everything is available, including noise. You just gotta know what you're looking at, right?
This is a bit difficult, but it shows how important diversity is in the subjects science uses in its experiments
The colours in the graphs are difference populations, AA, African American; EA, European American. X axis is how genetically similar they are to the "average" of 35,000 individuals in a diverse biobank (ATLAS) at the University of California, Los Angeles. The Y axis shows how good we are at interpreting the effect of their genome. In this case it is just height, but the same effect is to be expected in any medical multilocus genetic test, and quite possibly a lot of single locus tests as well.
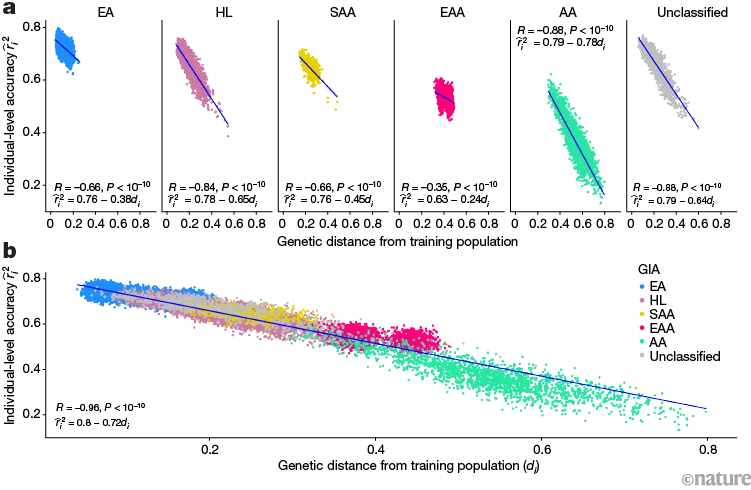
Examining the accuracy of a genetic score predicting height in individuals with different ancestries. Polygenic scores (PGSs) are estimates of the cumulative effect of thousands of genetic variants on the likelihood of having a certain trait. A PGS predicting height was trained on a subset of people annotated as white British in the UK Biobank. PGS accuracy was then tested for individuals (dots) with different ancestries in the ATLAS biobank in Los Angeles, California. a, PGS accuracy decreased with genetic distance (genetic dissimilarity; di) from the training population, in clusters with homogeneous or admixed and unclassified genetic ancestries. b, Individual PGS accuracy decreases with genetic distance from the training population across the entire ATLAS biobank. R and P refer to the correlation between genetic distance and individual-level PGS accuracy and its statistical significance, respectively. AA, African American; EA, European American; EAA, East Asian American; GIA, genetically inferred ancestry; HL, Hispanic or Latino American; SAA, South Asian American.
Source
The colours in the graphs are difference populations, AA, African American; EA, European American. X axis is how genetically similar they are to the "average" of 35,000 individuals in a diverse biobank (ATLAS) at the University of California, Los Angeles. The Y axis shows how good we are at interpreting the effect of their genome. In this case it is just height, but the same effect is to be expected in any medical multilocus genetic test, and quite possibly a lot of single locus tests as well.
Examining the accuracy of a genetic score predicting height in individuals with different ancestries. Polygenic scores (PGSs) are estimates of the cumulative effect of thousands of genetic variants on the likelihood of having a certain trait. A PGS predicting height was trained on a subset of people annotated as white British in the UK Biobank. PGS accuracy was then tested for individuals (dots) with different ancestries in the ATLAS biobank in Los Angeles, California. a, PGS accuracy decreased with genetic distance (genetic dissimilarity; di) from the training population, in clusters with homogeneous or admixed and unclassified genetic ancestries. b, Individual PGS accuracy decreases with genetic distance from the training population across the entire ATLAS biobank. R and P refer to the correlation between genetic distance and individual-level PGS accuracy and its statistical significance, respectively. AA, African American; EA, European American; EAA, East Asian American; GIA, genetically inferred ancestry; HL, Hispanic or Latino American; SAA, South Asian American.
Source
Another difficult one
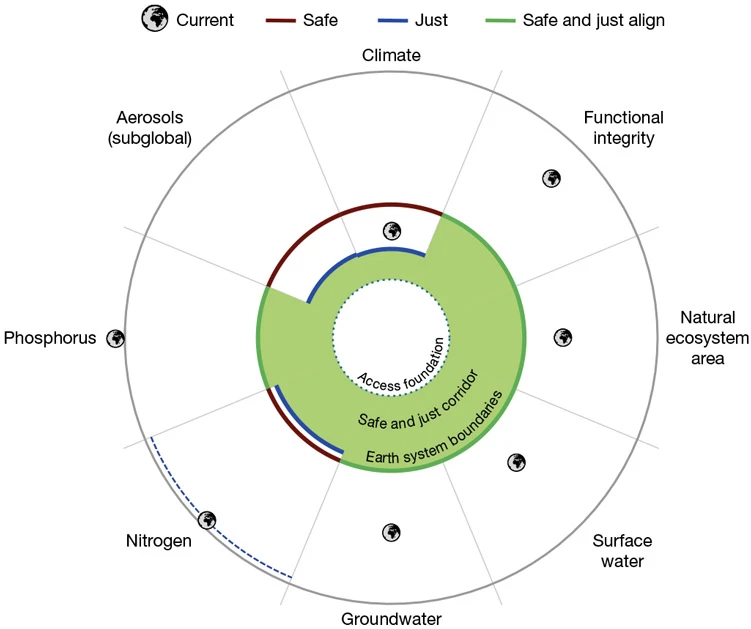
In 2009, a seminal paper in Nature showed that humanity had crossed three of nine ‘Earth-system boundaries’: the limits of what the planet can support before human activities make it uninhabitable. Now, there’s a reboot of the extraordinarily influential concept that takes into account how changes to climate, ecosystems and other factors disproportionately affect vulnerable communities. We have crossed seven of the eight safe and just boundaries. Only air pollution was inside dangerous limits globally, despite it causing an estimated 4.2 million deaths annually. If our planet got a check-up, “our doctor would say that the Earth is really quite sick right now, and it is sick in terms of many different areas or systems, and this sickness is also affecting the people living on Earth”, says climate-policy researcher and co-author Joyeeta Gupta.


Associated Press | 6 min read Paper 1 Paper 2
In 2009, a seminal paper in Nature showed that humanity had crossed three of nine ‘Earth-system boundaries’: the limits of what the planet can support before human activities make it uninhabitable. Now, there’s a reboot of the extraordinarily influential concept that takes into account how changes to climate, ecosystems and other factors disproportionately affect vulnerable communities. We have crossed seven of the eight safe and just boundaries. Only air pollution was inside dangerous limits globally, despite it causing an estimated 4.2 million deaths annually. If our planet got a check-up, “our doctor would say that the Earth is really quite sick right now, and it is sick in terms of many different areas or systems, and this sickness is also affecting the people living on Earth”, says climate-policy researcher and co-author Joyeeta Gupta.
Spoiler Legend :
Planetary boundaries reboot. The concept of ‘planetary boundaries’ has been updated to take into account the fact that everyone, particularly the most vulnerable, has an absolute right to water, food, energy and health, alongside the right to a clean environment. The red lines indicate a limit to what is ‘safe’ for the planet. The green space represents the threshold that is both safe for the planet and protects the world’s most vulnerable populations (‘safe and just’). The Earth-shaped icons show how, in seven of eight cases, thresholds for a safe and just world have already been crossed.
Spoiler Two more graphs and a map that may or may not help :
Associated Press | 6 min read Paper 1 Paper 2
Last edited:
Similar threads
- Replies
- 4
- Views
- 464
- Replies
- 128
- Views
- 14K
- Replies
- 353
- Views
- 22K