[RD] Daily Graphs and Charts

Status
Not open for further replies.
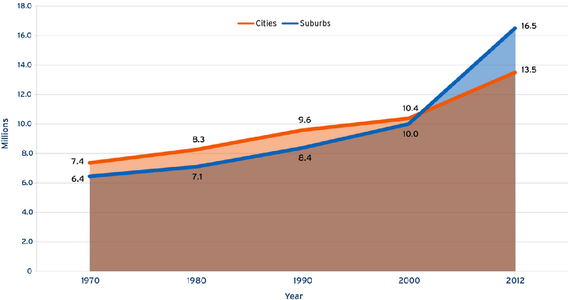
Poor Residents in US Cities and Suburbs, 1970-2012

Confronting Suburban Poverty, Brookings Institution Analysis of Decennial Census and ACS Data
 
I think the distinction of cities and suburbs in the US is largely artificial. With some notable exceptions like NYC, San Francisco and a few others, most US cities are essentially big suburbs with a small urban core.
 
I'm curious how they delineated the two from census geography. Maybe some relative density and proximity filters?
 
I think the distinction of cities and suburbs in the US is largely artificial. With some notable exceptions like NYC, San Francisco and a few others, most US cities are essentially big suburbs with a small urban core.

I'm curious how they delineated the two from census geography. Maybe some relative density and proximity filters?

One thing in the US, because of the localism that dominates politics, the cities and the suburbs are for the most part separate legal entities. And those separate legal entities in most cases predate the transition of one of those entities from 'town' to 'city'. Further, 'city' isn't too hard and fast of a definition. So for example New York City has a population density of 27,778.7/sq mi, where for Omaha, which is also called a city, it's only 3,217.9/sq mi. What makes one place a city is that people and businesses concentrated there, and the population grew earlier. What makes one a suburb rather than the city is that, at one point in time at any rate, the suburbs were places 'fed' people to the cities. So they were just places to live, and mostly for people who worked and shopped in the cities.

That broke down when much of retail and other businesses left the cities for the suburbs. Now most people in the suburbs surrounding a city rarely if ever actually go into the city itself. And that is largely an artifact of the racial and class segregation which accompanied the rise of the suburbs with the rise of the automobile and road system. Particularly the interstate highways after WWII. The poor, mostly minorities, were locked into the cities and the middle class, mainly white, left them.

The trend you're seeing towards more poverty in the suburbs is gentrification of many city neighborhoods is reducing the stock of housing that the poor can afford within the cities, and so driving them to the less attractive inner suburbs. Also, the decline in earning potential of the low skilled worker and the rise of minimum wage, and less, retail service jobs means that there's more suburban people who simply cannot earn their way out of poverty any longer.
 
Oh it's the same here. The City of Brisbane is the entire Brisbane metro area and then some, containing2 million people. The City of Sydney keeps changing at the whim of state govt but generally only has maybe 100k out of a 5 million metro area containing 40 local governments. The place I grew up with was a few towns of 5k to 20k a half hours drive from one another all contained within a local government area called the City of Shoalhaven.

My query is more statistical and logistic. To make that graph they needed identify suburbs and city core geographical areas from census data. You can't infer that from legal entities. I doubt they made case-by-case category decisions for the entire country.

So they've had to have used census data that has it's own statistical geography, which is independent of govt boundaries and follows consistent metro area definitions based on labour markets.

There'd have been some sort of filter applied to small geographical areas to flag them as cities and suburbs. I'm just wondering how they are being identified in that data.


I'm not sure I follow. If you used metropolitan area, then that is all of the city and all of the suburbs combined. Anything not within the metropolitan area is, by definition, not a suburb of the city. It is a rural area outside of the metropolitan area. And in the US, 'metropolitan area' is an extremely broad term which includes small towns far from the cities which have little connection to the cities in any way, except that to some extent they are bedroom communities for the city.
 
I'm not sure I follow. If you used metropolitan area, then that is all of the city and all of the suburbs combined. Anything not within the metropolitan area is, by definition, not a suburb of the city. It is a rural area outside of the metropolitan area. And in the US, 'metropolitan area' is an extremely broad term which includes small towns far from the cities which have little connection to the cities in any way, except that to some extent they are bedroom communities for the city.
Censuses have multi level geographical classifications. you guys have Census Tracts - areas between 1200 and 8000 people. You also have Public Use Microdata areas. Those would, I assume, be the building blocks you'd want to use to build up this kind of analysis. With the right filters you could assign every tract as city, suburb or other. I'm just wondering aloud what those filters might be.

(Also your definitions of metro areas are likely to be the same as everyone else's - there's international standards around such things.)
 
I took today off from work and shut off my phone. :cooool:

I should have worked from home... On my way home I waited at my bus stop for like a half an hour.. I'm still getting over how cold my feet were (my boots apparently leak and my feet got a bit wet).
 
 
A cool graph about how much each income group gained in real income between 1988-2008.


I think it shines a light on why a lot of people like to claim that income distribution is getting worse, when in fact it has been getting better at the global scale. The takeaway:

-The ultra poor (poorest 5%) didn't do spectacularly, but still saw an increase in real income around 15%;
-The poor (10 to 40 percentile of income distribution) got much richer, with real gains in income from 40% to 65%;
-The global middle class (40 to 60 percentile) got even richer, with a real increase in income around 70%;
-The global upper middle class (60 to 75 percentile) did as well as the poor;
-The global rich (80 to 95 percentile), which includes the US lower middle class and middle class proper, did the worst of all groups, with real gains around 10%;
-The ultra rich (top 2 or 3%) did extremely well, but were not the biggest winners.

So "Occupy Wall Street" and whatnot speak for a relatively small group of rich people. Their concerns are not shared by the global poor and middle class.
 
Didn't their cause gain prominence after the period covered by this graph?

Sure, but they were protesting against a long term trend of stagnating incomes for the aforementioned group of rich people. Or that was the most coherent message that came across anyway. I suppose a lot of them had no idea what they were protesting.
 
I didn't think they were protesting for the rest of the world. It seems more likely they were concerned with what happened in the US after the Dot-Com Bubble. I'm not sure where you got the idea that they speak for the globe.
 
I didn't think they were protesting for the rest of the world. It seems more likely they were concerned with what happened in the US after the Dot-Com Bubble. I'm not sure where you got the idea that they speak for the globe.

Well. Sometimes they seemed to speak only of US problems, sometimes they tried to address global problems. The movement was not unified so it's hard to say. It certainly did attract a lot of foreign activists, and was intimately related to foreign movements, so it's hard to claim it was exclusively about US issues.

Occupy Wall Street (OWS) is the name given to a protest movement that began on September 17, 2011, in Zuccotti Park, located in New York City's Wall Street financial district, receiving global attention and spawning the Occupy movement against social and economic inequality worldwide.[7]
http://en.wikipedia.org/wiki/Occupy_Wall_Street

Anyway. My main point is not about Occupy Wall Street, which is dead and irrelevant anyway. It's about how people who say inequality is globally on the rise are wrong. And how stagnating incomes are only a real problem for a relatively small group of already rich people. Feel free to engage this point.
 
That's quite the statement you're making, luiz.
 
Status
Not open for further replies.
Top Bottom