You are using an out of date browser. It may not display this or other websites correctly.
You should upgrade or use an alternative browser.
You should upgrade or use an alternative browser.
[RD] Daily Graphs and Charts
- Thread starter Winner
- Start date
- Status
- Not open for further replies.
Lexicus
Deity
Lohrenswald
世界的 bottom ranked physicist
nuclear power isn't renewable
kind of a shame "renewable" and "environmentally friendly" are interused when they mean different things (even though I'd say nuclear is neither)
kind of a shame "renewable" and "environmentally friendly" are interused when they mean different things (even though I'd say nuclear is neither)
Lexicus
Deity
Well, nuclear is emission-free and while technically not renewable, it's sustainable enough as stopgap measure to help us get off fossil carbon that I think it should at least be included in the conversation. And if you include nuclear the "percentage of energy coming from not-fossil carbon" is probably a good deal higher in a lot of the Eastern states.
hobbsyoyo
Deity
- Joined
- Jul 13, 2012
- Messages
- 26,575
Yeah I thought it was weird that Missouri and Illinois ranked so low when I know they have some nuclear power stations between them. Nuclear is effectively renewable, especially with the recycling technologies now available for turning less useful nuclear waste back into fuel.
I put the map in the (sus) category but appreciate the fact that @Cutlass posted it.
I put the map in the (sus) category but appreciate the fact that @Cutlass posted it.
Funfact, ~8% of the male population is colorblind. It takes basically zero effort to make an infographic that allows for this.
hobbsyoyo
Deity
- Joined
- Jul 13, 2012
- Messages
- 26,575
This is false.No it's not. With the current pace we'll run out of the relevant material fairly quickly, particularly if we were to multiply consumption which would be necessary to have any significant impact.
At the start of 2015, identified uranium reserves recoverable at US$130/kg were 5.7 million tons.[9] At the rate of consumption in 2014, these reserves are sufficient for 135 years of supply.
And that is ignoring advances in recycling technology.
Back to the point of the thread:
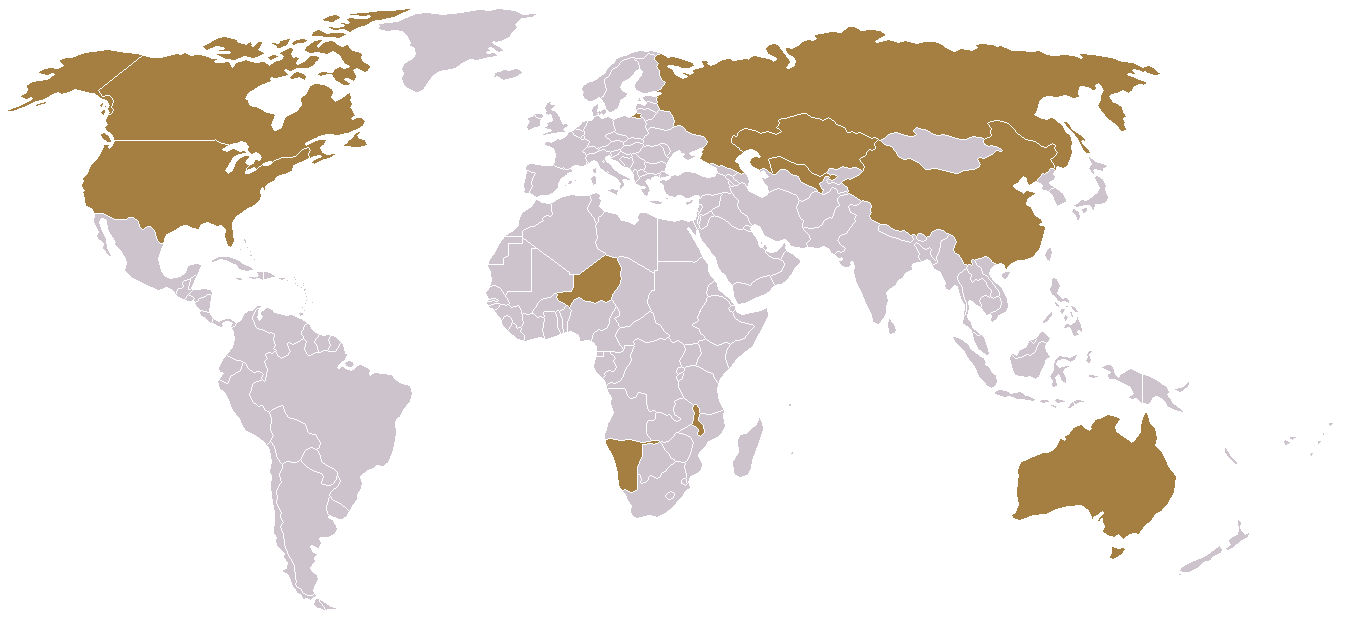
These are the world's top Uranium extractors.
And this is how much they extract:

hobbsyoyo
Deity
- Joined
- Jul 13, 2012
- Messages
- 26,575
The issue wasn't what would happen should global nuclear consumption increase, it was whether or not it was a useful stop gap. It would be a massive net loss if the rest of the world followed France and Germany's lead and replaced decommissioned nuclear plants with coal plants.And global electricity generation is like 10% nuclear. You see the problem here?
In any case you've moved the goal post rather than refute the argument that was made.
It's still there.You deleted the graph. I knew I should have quoted it. Ha!
hobbsyoyo
Deity
- Joined
- Jul 13, 2012
- Messages
- 26,575
Here was the link I used before. Does it work now?
https://www.instituteforenergyresearch.org/fossil-fuels/coal/france-germany-turn-coal/
I have not looked into the reputation of the institute of energy research. I just took the first source for the google search that confirmed what I remembered reading elsewhere.
https://www.instituteforenergyresearch.org/fossil-fuels/coal/france-germany-turn-coal/
I have not looked into the reputation of the institute of energy research. I just took the first source for the google search that confirmed what I remembered reading elsewhere.
hobbsyoyo
Deity
- Joined
- Jul 13, 2012
- Messages
- 26,575
Also, I'm not arguing that the nuclear plants that have been shut down shouldn't have been shut down. There are a lot of obsolete reactors in the first world that need replacement. The problem is that what replaced them was worse from an environmental stance.
Edit: Nor is this a uniquely French and German problem. It is just notable given the public stance of those governments on environmental issues.
Edit: Nor is this a uniquely French and German problem. It is just notable given the public stance of those governments on environmental issues.
Silurian
Deity
- Joined
- Jan 5, 2010
- Messages
- 7,567
The issue wasn't what would happen should global nuclear consumption increase, it was whether or not it was a useful stop gap. It would be a massive net loss if the rest of the world followed France and Germany's lead and replaced decommissioned nuclear plants with coal plants.
In any case you've moved the goal post rather than refute the argument that was made.
Your claim is false that France is closing nuclear plants and replacing them with coal plants.
France (which is ~80% nuclear) had many nuclear plants shut down for inspection.
Silurian
Deity
- Joined
- Jan 5, 2010
- Messages
- 7,567
Since reading graphs is much less your thing than making highly aggressive yet incorrect claims, maybe try this one.
So lignite (brown) and hard (black) coal are producing 62.5TWh less than 2003 whilst nuclear has also declined by 89.2TWh.
Not sure how you replace nuclear in Germany with coal when coal use is falling also.
Natural gas use seems to be going up and down; 63, 89, 68, 61, 62, 81, 86; almost as if it was being switched on and off when other sources could not meet demand.
So there does not seem to be a problem in Germany where they are closing nuclear plants
Hey, DC is really green, that's p kewl
Also do you know what the definition of renewable sources in that map is, @Cutlass? Are they excluding nuclear?
They have to be excluding nucklear. Connecticut is 50% nuclear (which is why it is the Lower 48's most expensive electricity) and the map shows it 10%- of renewable.
The legend specifically says renewables share of electricity. That doesn't include nuclear power in every source of energy statistics I'm familiar with.
Now a graph of the per-MWh carbon intensity of electricity supply or demand in each state would be a different thing.
Now a graph of the per-MWh carbon intensity of electricity supply or demand in each state would be a different thing.
Eg this https://www.electricitymap.org
Moderator Action: This is an RD thread, as you might recall. Please try to respect that categorisation. Thank you.
Please read the forum rules: http://forums.civfanatics.com/showthread.php?t=422889
Please read the forum rules: http://forums.civfanatics.com/showthread.php?t=422889

- Status
- Not open for further replies.