[RD] Daily Graphs and Charts

Status
Not open for further replies.
pigs wouldn't eat a sausage roll surely

Also I like all the food that people have so far complained about. I like liking lots of different types of food.
 
WTH, what seafood tastes like cheese?!

Seriously man. Seafood is like all over the place. Sort it out, vastness of the ocean.

So is cheese. Cheese can be anywhere from very mild to very strong.

Especially odd is that mixing seafood and cheese is sort of faux pas in many cultures.

The only thing I can think is they both tend to be salty and have a tendency to pick up ammonia like flavors when stored improperly.
 
Spoiler :
oap-landsea-oceans-100608-moderate.jpg


another pretty cool infographic.
 
Here's an old one I dug up from 1997, showing the cost of the Gulf war and who paid for it. Sadly, the USA are not in the graph, but you can see from the numbers of the website that it cost Germany almost as much money as the USA.

NonUS_GW_gifts.gif


from the website:
How much did the Gulf War cost the US

How much did the US pay for the Gulf War above and beyond the yearly cost for supporting its military? The US Department of Defense estimated the incremental cost at $61 billion. This additional cost included deployment, construction and operations in the Gulf. However, $54 billion was offset by contributions of other members in the Coalition. Two-thirds of the $54 billion was provided by the Gulf States ($36 billion) with the remaining one-third mostly provided by Japan and Germany ($16 billion).

Notes on the graph:

Payments were made in one of two ways: with financial assets ("Cash") and with services such as sealift and airlift ("In-Kind")
As of March 1992, there was a shortfall in receipts compared with commitments. The total amount committed was $54 billion but only $52.9 billion had been received. The shortfall was $1.1 billion.
Saudi Arabia provided the US Military with fuel, food, water, local transportation and facilities, accounting for the "In-Kind" assistance. This accounted for 25% of the Saudi commitment to the US Military presence and was 71% of all "In-Kind" contributions.
The US paid roughly $7 billion, less than 12% of the total US cost and less than half what Saudi Arabia and Kuwait paid.
 
Wow you can rent the US army? Gogo conquer France noaw!
 
Nine-nine-nine. Makes a nice slogan, doesn't it ?
 
Oh my god, these charts should be posted all over the country.
 
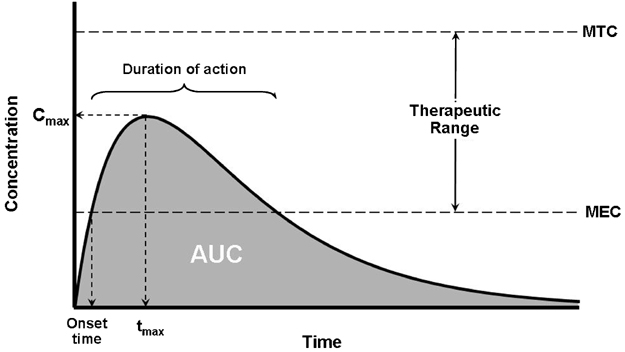
Right, how about some pharmacokinetics?
plasma-level-curve.jpg

Blood plasma level for a drug taken orally.

C max - maximum concentration
t max - time to C max (rate of absorption is the former divided by this)
AUC - area under the curve (total extent of absorption)
MEC - minimum effective concentration (below this, the drug won't have any significant effect)
MTC - maximum tolerated concentration (above this, it's an overdose)

The narrower the therapeutic range, the more precise doses need to be.
 
Expected temperature changes in a business-as-usual CO2 emissions scenario:
Global_Warming_Predictions_Map.gif

Based on the Hadley Center HadCM3 climate model. (Source) The arctic and northern South America get the biggest effects. The arctic prediction makes easy sense: ice-melt and albedo change. I don't get the South American prediction.
 
Status
Not open for further replies.
Back
Top Bottom