So, they higher the income gets, you get less Andersons and more noblemen, so that eventually there's more noble people that commoners. Why does this surprise you?pic url
comparison of contemporary income of Swedes with the commoner surname Anderson and Swedes with a noble surname, indicating social status of ancestors 300 years ago. there is quite a bit of persistance.
You are using an out of date browser. It may not display this or other websites correctly.
You should upgrade or use an alternative browser.
You should upgrade or use an alternative browser.
[RD] Daily Graphs and Charts
- Thread starter Winner
- Start date
- Status
- Not open for further replies.
Monsterzuma
the sly one
- Joined
- Jun 1, 2008
- Messages
- 2,984
it doesn't surprise so much as confirm a suspicion. the surnames were given 300 years ago and indicate social status in that period. nowadays the difference in wealth as a residual from that time is still clearly visible despite that Sweden is a comparatively economically mobile country.
Monsterzuma
the sly one
- Joined
- Jun 1, 2008
- Messages
- 2,984

Ayatollah So
the spoof'll set you free
Monster, that graph (#4249) is highly illuminating, thanks
So as not to come to the thread empty handed, I give you a graph of student improvement. The graph shows the results of the "value added" approach to measuring teacher effectiveness by student test scores.
Dean Baker wrote in 2012:

So as not to come to the thread empty handed, I give you a graph of student improvement. The graph shows the results of the "value added" approach to measuring teacher effectiveness by student test scores.
Dean Baker wrote in 2012:
New York City Chancellor Dennis M. Walcott [...] apparently thought it was a clever idea to make public measures of teacher value-added by school class. This measure is supposed to show how much a set of students improved their test scores under a teacher, after controlling for various demographic characteristics.
In fact, it turns out that there is enormous variation in results even for the same teacher in the same year, in some cases teaching the same subject. This graph matches the results for teachers who taught the same subject to two different grades (e.g. 5th grade and 6th grade math). There is almost no correlation in results, with many teachers scoring near the top in one class and near the bottom in the other class.

Silurian
Deity
- Joined
- Jan 5, 2010
- Messages
- 7,567
Why do people who make $78k get 18% of their earnings via social security?
Or am I reading that wrong?
I'm also curious how someone who makes $6k a year is able to use his/her assets to make a regular income.
The assets could be a few shares etc.
$4000 of shares giving a return of 5% gives you $200 income a year.
Goes to show that often thrown around line that nobody profited as much from globalization as the rich is quite false!
Hygro
soundcloud.com/hygro/
Goes to show that often thrown around line that nobody profited as much from globalization as the rich is quite false!
No, it doesn't, for a few reasons:
1) because that top 1% is 70,000,000 people. If the graph wasn't averaging them out, the top would be literally well off the top of the chart. When 85 folk have as much wealth as the bottom half, and 400 or so as much as the bottom half of Americans, we aren't being fine tuned enough to make the claim you are making.
2) It is showing percentages relative to previous incomes. A billion people moving from $1/day to $2/day is really good, like, if you feel what that means its overwhelming. But for the billion who experienced that, that's a billion in income growth per year. It took 20 years or so, so rule of 72 means about 3.6%/year gains , sum the gains, subtract $20 billion, that's I dunno, guesstimating here, $20 billion (I could be off by a factor of 2)? Meanwhile John Paulson made $4 billion in personal money in 2007. One guy made a quarter of the total gains of the biggest proportional winners in one year that an entire sixth (remember, 1988-2008) of the world population did in 20 years.
Let's get real, the actual money gains in this financialized globalized economy is mostly going to a handful of folks.
What the graph does show is that there are real gains from 1988-2008 for most people, and that's awesome and great. But let's not get it twisted.
Also, why does the graph start at 5%? How bad is are the first twentieth down at the bottom? Very sketchy.
warpus
Sommerswerd asked me to change this
This is a retirement income graph.
Ahh so social security includes retirement money.. Gotcha.
Why are the retired making 44% of their income via earnings though? Aren't they retired and thus no longer working?
To others who replied to me, that all makes sense.
Hygro
soundcloud.com/hygro/
Ahh so social security includes retirement money.. Gotcha.
Why are the retired making 44% of their income via earnings though? Aren't they retired and thus no longer working?
That's my error, it said age 65+ so some folks are still working. And since most the people 65+ are closer to 65 than they are to, say, 95, a fair amount are still working.
Great album, great graphics work. Poast belongs in this thread.nevermind.
No, it doesn't, for a few reasons:
1) because that top 1% is 70,000,000 people. If the graph wasn't averaging them out, the top would be literally well off the top of the chart. When 85 folk have as much wealth as the bottom half, and 400 or so as much as the bottom half of Americans, we aren't being fine tuned enough to make the claim you are making.
2) It is showing percentages relative to previous incomes. A billion people moving from $1/day to $2/day is really good, like, if you feel what that means its overwhelming. But for the billion who experienced that, that's a billion in income growth per year. It took 20 years or so, so rule of 72 means about 3.6%/year gains , sum the gains, subtract $20 billion, that's I dunno, guesstimating here, $20 billion (I could be off by a factor of 2)? Meanwhile John Paulson made $4 billion in personal money in 2007. One guy made a quarter of the total gains of the biggest proportional winners in one year that an entire sixth (remember, 1988-2008) of the world population did in 20 years.
Let's get real, the actual money gains in this financialized globalized economy is mostly going to a handful of folks.
What the graph does show is that there are real gains from 1988-2008 for most people, and that's awesome and great. But let's not get it twisted.
Also, why does the graph start at 5%? How bad is are the first twentieth down at the bottom? Very sketchy.
Well proportionally the biggest winners have not been the super rich but rather the poor (not the super poor). Obviously even a small percentage gain for a super rich person will outstrip that of countless poor people, but that doesn't mean the world got more unequal. In a hypothetical scenario where billionaires had their incomes increased by 1% while the poor had their incomes increased by 100%, even if the actual money increase is bigger for the billionaire we still say overall there was a decrease in income inequality.
It's a bit of a paradox that if you look inside a country such as China their income inequality is getting worse, but the effect of the rising middle class in China (who are still relatively poor) is that on global terms inequality is dropping. That's because compared to middle class Americans and Europeans the rising Chinese and Indians are still quite poor, so their rising income coupled with the stagnating incomes of middle class Westerners contribute to a decrease in inequality.
Traitorfish
The Tighnahulish Kid
So what you're arguing is,Well proportionally the biggest winners have not been the super rich but rather the poor (not the super poor). Obviously even a small percentage gain for a super rich person will outstrip that of countless poor people, but that doesn't mean the world got more unequal. In a hypothetical scenario where billionaires had their incomes increased by 1% while the poor had their incomes increased by 100%, even if the actual money increase is bigger for the billionaire we still say overall there was a decrease in income inequality.
1 billion - 1 > 1.01 billion - 2.
Who knew?
So what you're arguing is,
1 billion - 1 > 1.01 billion - 2.
Who knew?
No, I'm arguing that if your income grows by 10% while mine grows by 5% we say your income is growing faster than mine even if my actual dollar amount increase was bigger than yours as a result of I earning over twice what you do.
Traitorfish
The Tighnahulish Kid
But your exact wording was "overall there was a decrease in income inequality". Did you misspeak, or are you altering your position?No, I'm arguing that if your income grows by 10% while mine grows by 5% we say your income is growing faster than mine even if my actual dollar amount increase was bigger than yours as a result of I earning over twice what you do.
Hygro
soundcloud.com/hygro/
Well proportionally the biggest winners have not been the super rich but rather the poor (not the super poor). Obviously even a small percentage gain for a super rich person will outstrip that of countless poor people, but that doesn't mean the world got more unequal. In a hypothetical scenario where billionaires had their incomes increased by 1% while the poor had their incomes increased by 100%, even if the actual money increase is bigger for the billionaire we still say overall there was a decrease in income inequality.
It's a bit of a paradox that if you look inside a country such as China their income inequality is getting worse, but the effect of the rising middle class in China (who are still relatively poor) is that on global terms inequality is dropping. That's because compared to middle class Americans and Europeans the rising Chinese and Indians are still quite poor, so their rising income coupled with the stagnating incomes of middle class Westerners contribute to a decrease in inequality.
Notice how few data points are on the graph. The gap between the richest and everyone else has increased, and you cannot point to that graph to disprove it.
The final data point on that graph looks to be the top 2% or so. That's 140 million people. That skews things pretty hard. We don't even know if they are using mean income for section or the value at that percentile.
The only takeaway from this graph is that most folks in the bottom half have seen real gains from terrible to less terrible, which is good, and that people near the top third have not seen gains (or even lost out) and it starts increasing once it goes up but cuts off before we get to the juicy part.
Wanna see this juicy part? Here's real:
Link to video.
But your exact wording was "overall there was a decrease in income inequality". Did you misspeak, or are you altering your position?
I didn't misspeak. There is indeed a decrease in inequality in the scenario I described.
Here's the math, on a very simplified but illustrative scenario:
Say you made $4 the previous year and now makes $5.
Say I made $10 the previous year and now make $12.
In absolute terms, my increase was twice as big as yours. But because your increase was in relative terms bigger, your share of the pie increased on the second scenario. See, on the previous year you made 28.6% (4/14) of the total, while on the second year you made 29.4% (5/17).
So even though my monetary increase was 100% superior to yours, inequality decreased. That's because your income increased by 25% while mine increased by 20%.
cuts off before we get to the juicy part.
Wanna see this juicy part? Here's real:
While the bizarre wealth of the richest Americans is indeed shocking, the video used some tactics to make it more extreme. First, it only focuses on wealth, which is of course far more concentrated than income. In any given society, even equitable Scandinavia, a large portion of society will have zero or near-zero net worth. Students, people with debt, the quite poor in general living from paycheck to paycheck or on the government dole. Of course, when you compare the wealth of this group (near zero) with that of the top 1%, or even just with the richest individual, you'll get a "shocking" result. But the fact is if you have a net worth of $1,000 you still have a bigger net worth than the ALL THE PEOPLE WHO HAVE ZERO OR NEGATIVE NET WORTH IN THE WORLD COMBINED!!!! You can make a shocking video out of that, but it doesn't really mean anything.
My second point is that asking people what the "ideal" income distribution should be strikes me as peculiar. I don't know how to answer that question, and I don't think anyone does. It's ridiculous on the face of it.
That said, yeah, inequality in the US is big and growing (or so it was until 2008 anyway, I know it receded a bit after the crisis and don't know how it's been since)
Hygro
soundcloud.com/hygro/
What do you mean it doesn't mean anything. It means some people have extreme levels of agency that effect the lives of others, those others who have virtually no agency who have little choice but to follow market-logic dictated by variables from which the richest people have set.
The entire point though, is that wealth is actually a better measure than income for this thing, and the nil net worth of the bottom is a big part of the story. And when your top income (not wealth) data bracket is far too big that it obscures the important parts, but when it nevertheless shows income gains that increase wealth stock (vs the income gains for lower income folks that do not increase the wealth stocks) the result is that the graph above, useful as it is to make points about people between the 20th and 80th percentiles, absolutely does not prove the point you said it did in your original response to the graph about how there aren't these out-of-proportion gains made by the richest.
The entire point though, is that wealth is actually a better measure than income for this thing, and the nil net worth of the bottom is a big part of the story. And when your top income (not wealth) data bracket is far too big that it obscures the important parts, but when it nevertheless shows income gains that increase wealth stock (vs the income gains for lower income folks that do not increase the wealth stocks) the result is that the graph above, useful as it is to make points about people between the 20th and 80th percentiles, absolutely does not prove the point you said it did in your original response to the graph about how there aren't these out-of-proportion gains made by the richest.
Mise
isle of lucy
I wrote a long-ass post (with a graph!) that in the end didn't go anywhere. What I really wanted to say is this:
I agree with Hygro.
We're all some form of liberal, and we all believe that increasing liberty should be the primary goal of government and society. When Hygro talks about one group having extreme agency, and another having virtually no agency, this is is a statement about liberty. Going from $1 to $2 no doubt increases income by 100% (we all understand the concept of percentages, luiz ), but does it increase liberty by 100%? No, absolutely not. Wealth, income, globalisation, rights, laws, nations themselves -- they're only good insofar as they increase liberty. Liberty should be the thing that we're measuring, and Hygro's argument about agency is the only one with any normative force.
I'm a pretty centrist guy these days, I believe in free markets, I believe in globalisation, and I believe in these things because I believe they can help empower the poorest with agency of their own, and make the world better place. What I don't believe in is this nonsense argument that in order for markets to be free and globalised, the top 1% must take such a massive proportion of the world's total wealth or income. Whether it's the biggest share or just a really f-ing big share, I don't care -- I reject the premise entirely. That doesn't make any god damn sense to me, yet it seems to be the premise of every single debate on this subject. Both left and right seem to accept the premise that free markets and globalisation are inextricably linked to the top 1% taking the lion's share of the wealth. It's utter hogwash.
Anyway since this is a graph thread and I was going to post a graph, here it is:
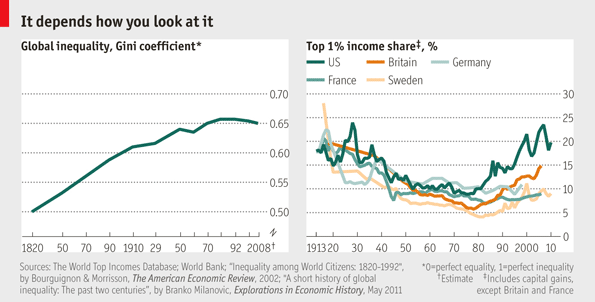
Source: http://www.economist.com/node/21564414
I agree with Hygro.
We're all some form of liberal, and we all believe that increasing liberty should be the primary goal of government and society. When Hygro talks about one group having extreme agency, and another having virtually no agency, this is is a statement about liberty. Going from $1 to $2 no doubt increases income by 100% (we all understand the concept of percentages, luiz
), but does it increase liberty by 100%? No, absolutely not. Wealth, income, globalisation, rights, laws, nations themselves -- they're only good insofar as they increase liberty. Liberty should be the thing that we're measuring, and Hygro's argument about agency is the only one with any normative force.I'm a pretty centrist guy these days, I believe in free markets, I believe in globalisation, and I believe in these things because I believe they can help empower the poorest with agency of their own, and make the world better place. What I don't believe in is this nonsense argument that in order for markets to be free and globalised, the top 1% must take such a massive proportion of the world's total wealth or income. Whether it's the biggest share or just a really f-ing big share, I don't care -- I reject the premise entirely. That doesn't make any god damn sense to me, yet it seems to be the premise of every single debate on this subject. Both left and right seem to accept the premise that free markets and globalisation are inextricably linked to the top 1% taking the lion's share of the wealth. It's utter hogwash.
Anyway since this is a graph thread and I was going to post a graph, here it is:
Source: http://www.economist.com/node/21564414
- Status
- Not open for further replies.
Similar threads
- Poll
- Replies
- 120
- Views
- 8K