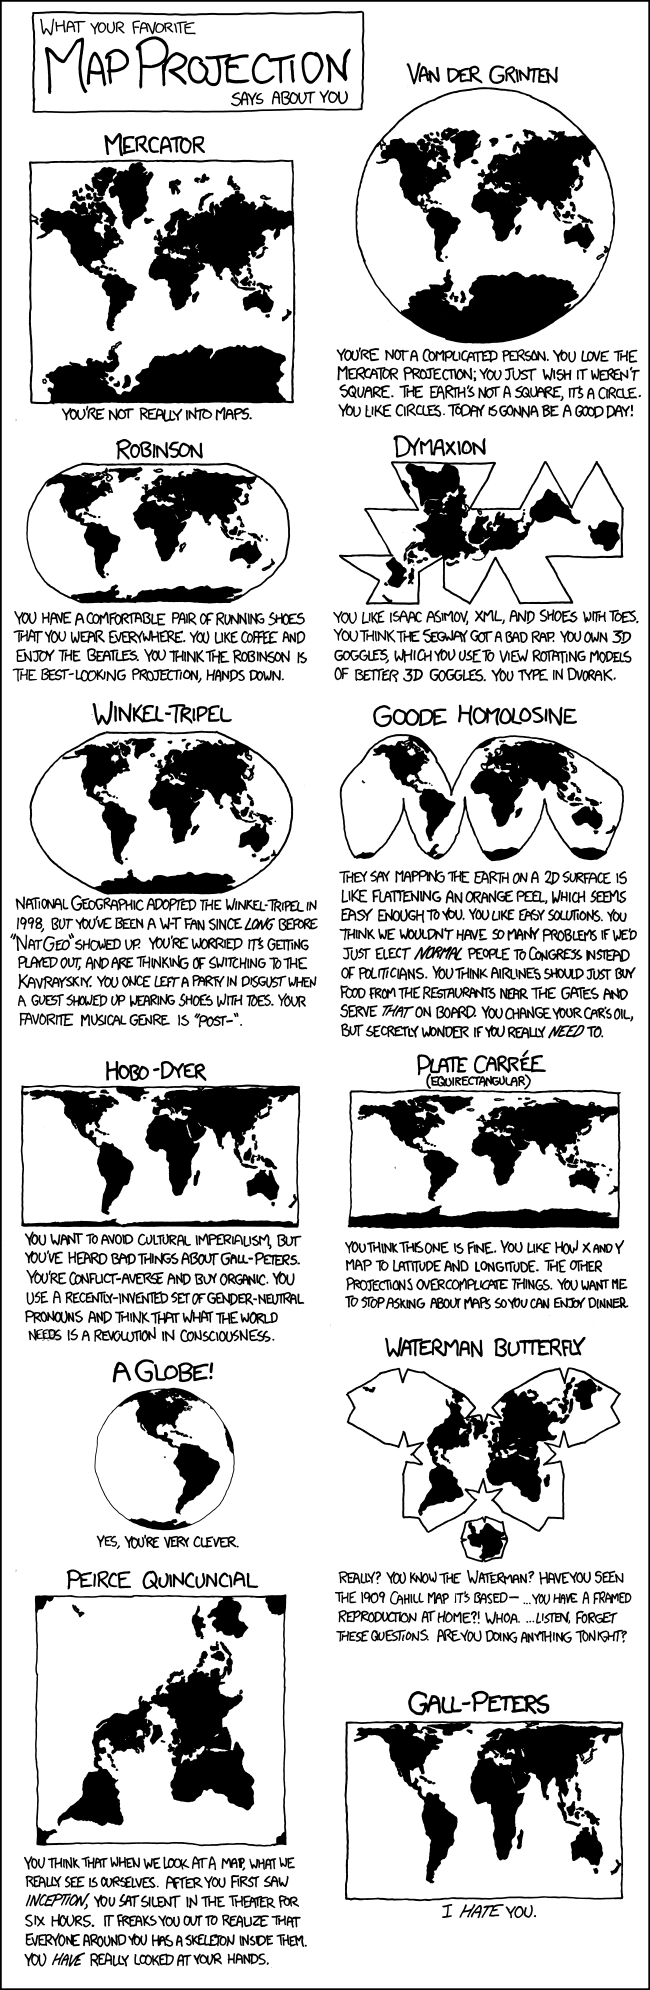
I'm actually disappointed that whoever made the map didn't use the usual Mercator projection, just to show it in even more stark terms. Afterall, that projection is the one we see the most, so seeing it like that would be a lot more salient anyway.
Sorry to re-quote, but i forgot to state the obvious:
You already got your wish - well in part at least. Cause the map posted is not an equal area projection. As one in the reddit thread pointed out, this is probably
Winkel III - a compromise projection.
Just look at Antartica...
And it's even worse, due to a circle being imposed unprojected.
As another one in the reddit thread pointed out,
this is what an actual circle would look like.
That already looks bigger. And if we were to use an equal area projection it would be even bigger, comparatively.
It would still be impressive, just not as much.
Well the BBC uses the Gall projection, which to me looks like a slightly less outrageous Mercator. Google uses a projection which again looks basically like the Mercator. I didn't mean to be specific about the Mercator, but the projection the graphic used certainly doesn't look like one commonly used here.
1. The maps that most people in the western world encounter most frequently (continental maps in TV weather reports) are roughly never rectangular maps (like Mercator or Peters) but generally compromise projections with strong emphasis on area and equidistance.
Cause equidistance kind of matters - a lot - if you have weather systems moving accross a static map. And be it just for aestetics if for nothing else.
2. Google kind of has to use a (bad, bad, evil) rectangular projection, since the primary use of google maps is to zoom in and look at city plans or even individual neighborhoods. Anything but a rectangular map would produce very oddly shaped houses, structures, egg shaped roundabouts etc.
Of course you could switch the projection when zooming out but that comes with its own set of problems.
3. Virtually every textbook map i have encountered in 13 years of public school and horribly many years of university was either equal area or a compromise with strong emphasis on either equal area or equidistance or both. Kavrayskiy, Mollweide, Winkel mostly.
I personally still find that Mollweide is very sexy. In particular it looks significantly less bad compared to other maps if you move the center away from the equator for whatever purpose.
Like this.
Oh, and this is not a new thing either. Look at this
Nazi public school textbook map (Germany, 1937).
Apparently they didn't get the memo about Mercator reinforcing notions of European supremacy.

(And yes, that's Winkel III, too).
I'd like to summarize all this by calling you way too pessimistic and everything, if it weren't for the fact that it's pretty damn hard to find an equal area population density map on the internet...
This is
the best i can come up with in a hurry. 2004. No funny circle that isn't a circle. No distortion that makes the contrast even more stark. And yet it's still impressive enough.
")