You are using an out of date browser. It may not display this or other websites correctly.
You should upgrade or use an alternative browser.
You should upgrade or use an alternative browser.
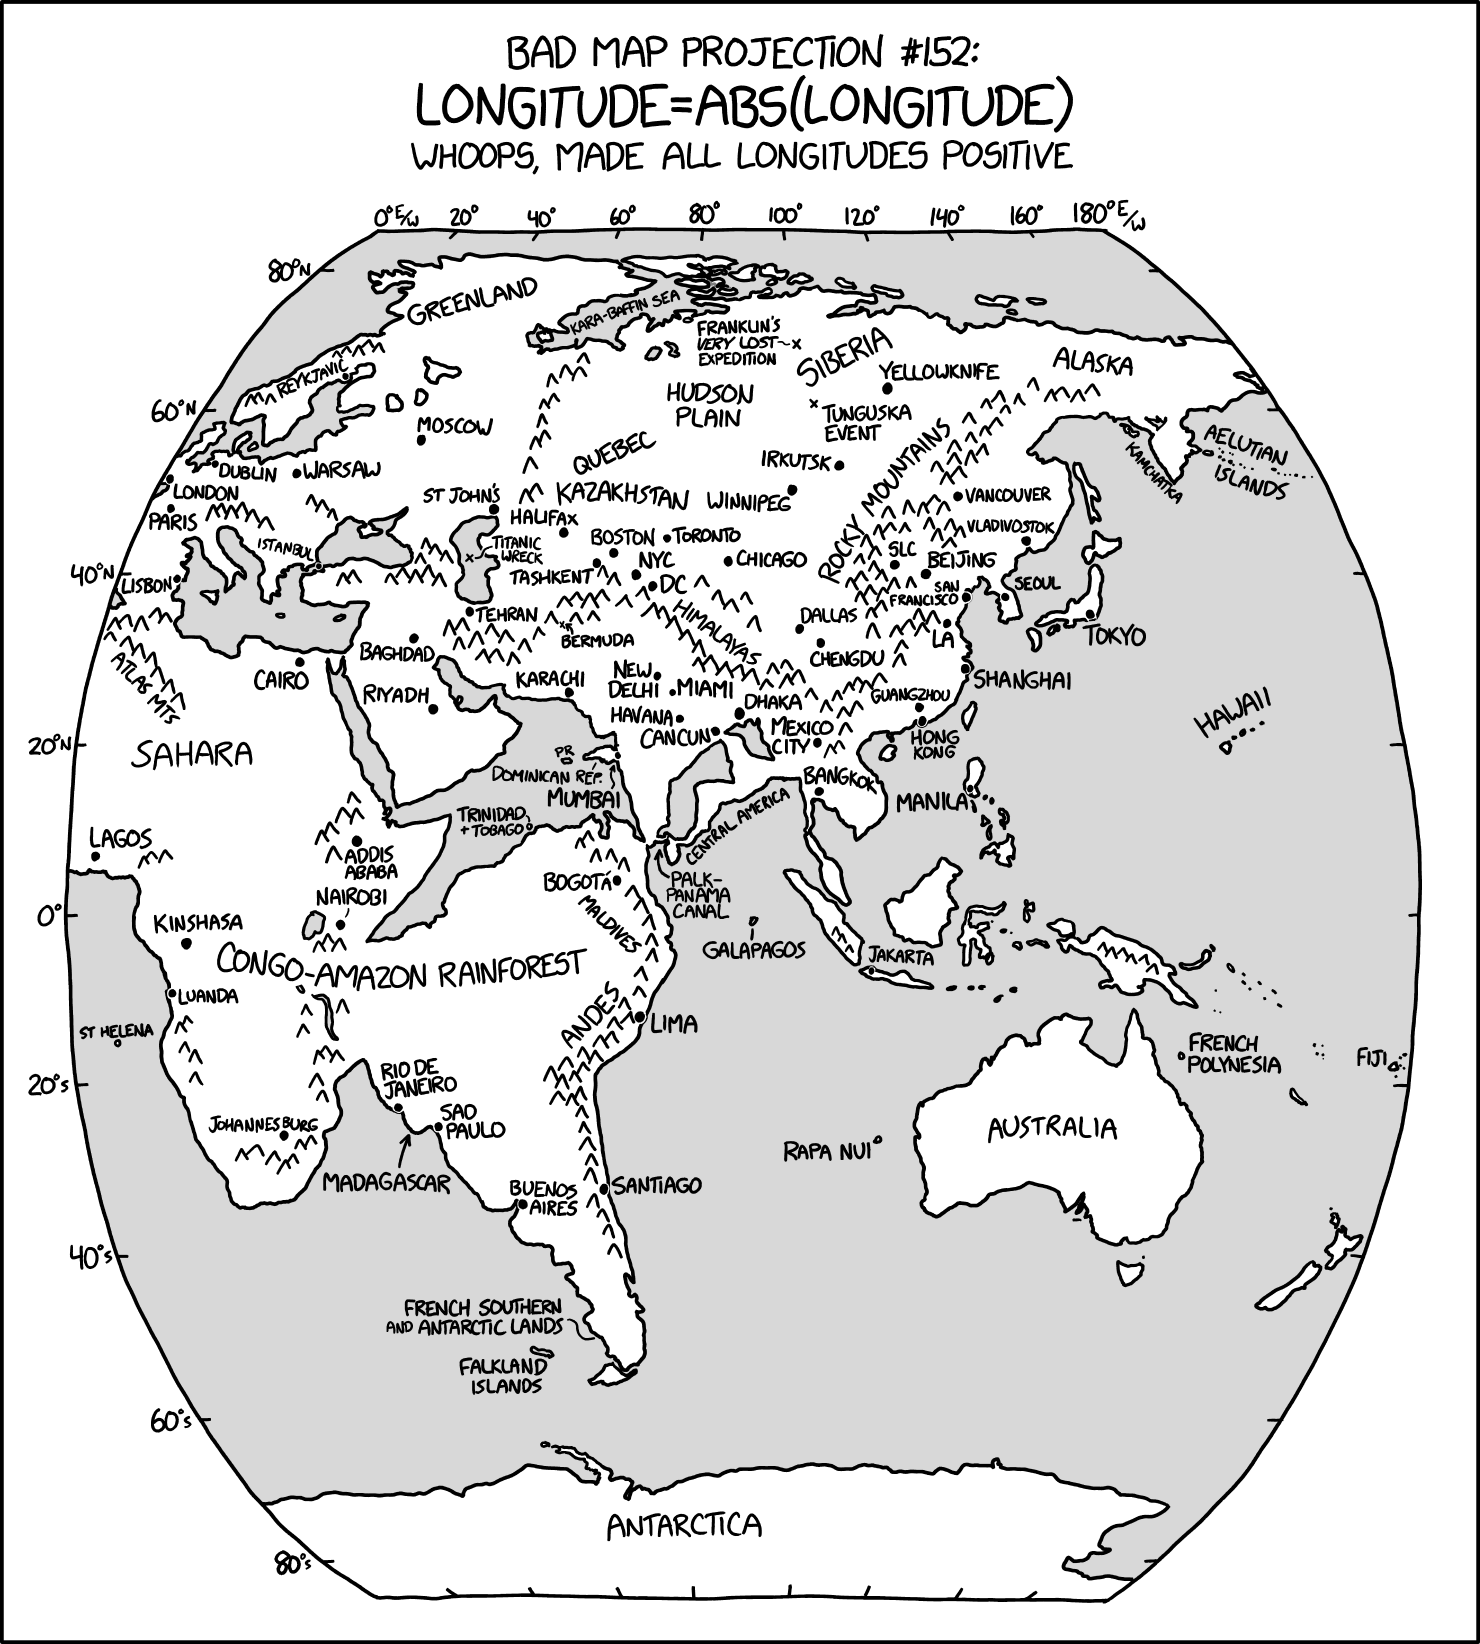
Altered maps IZ: gib clay!
- Thread starter Takhisis
- Start date
- Status
- Not open for further replies.


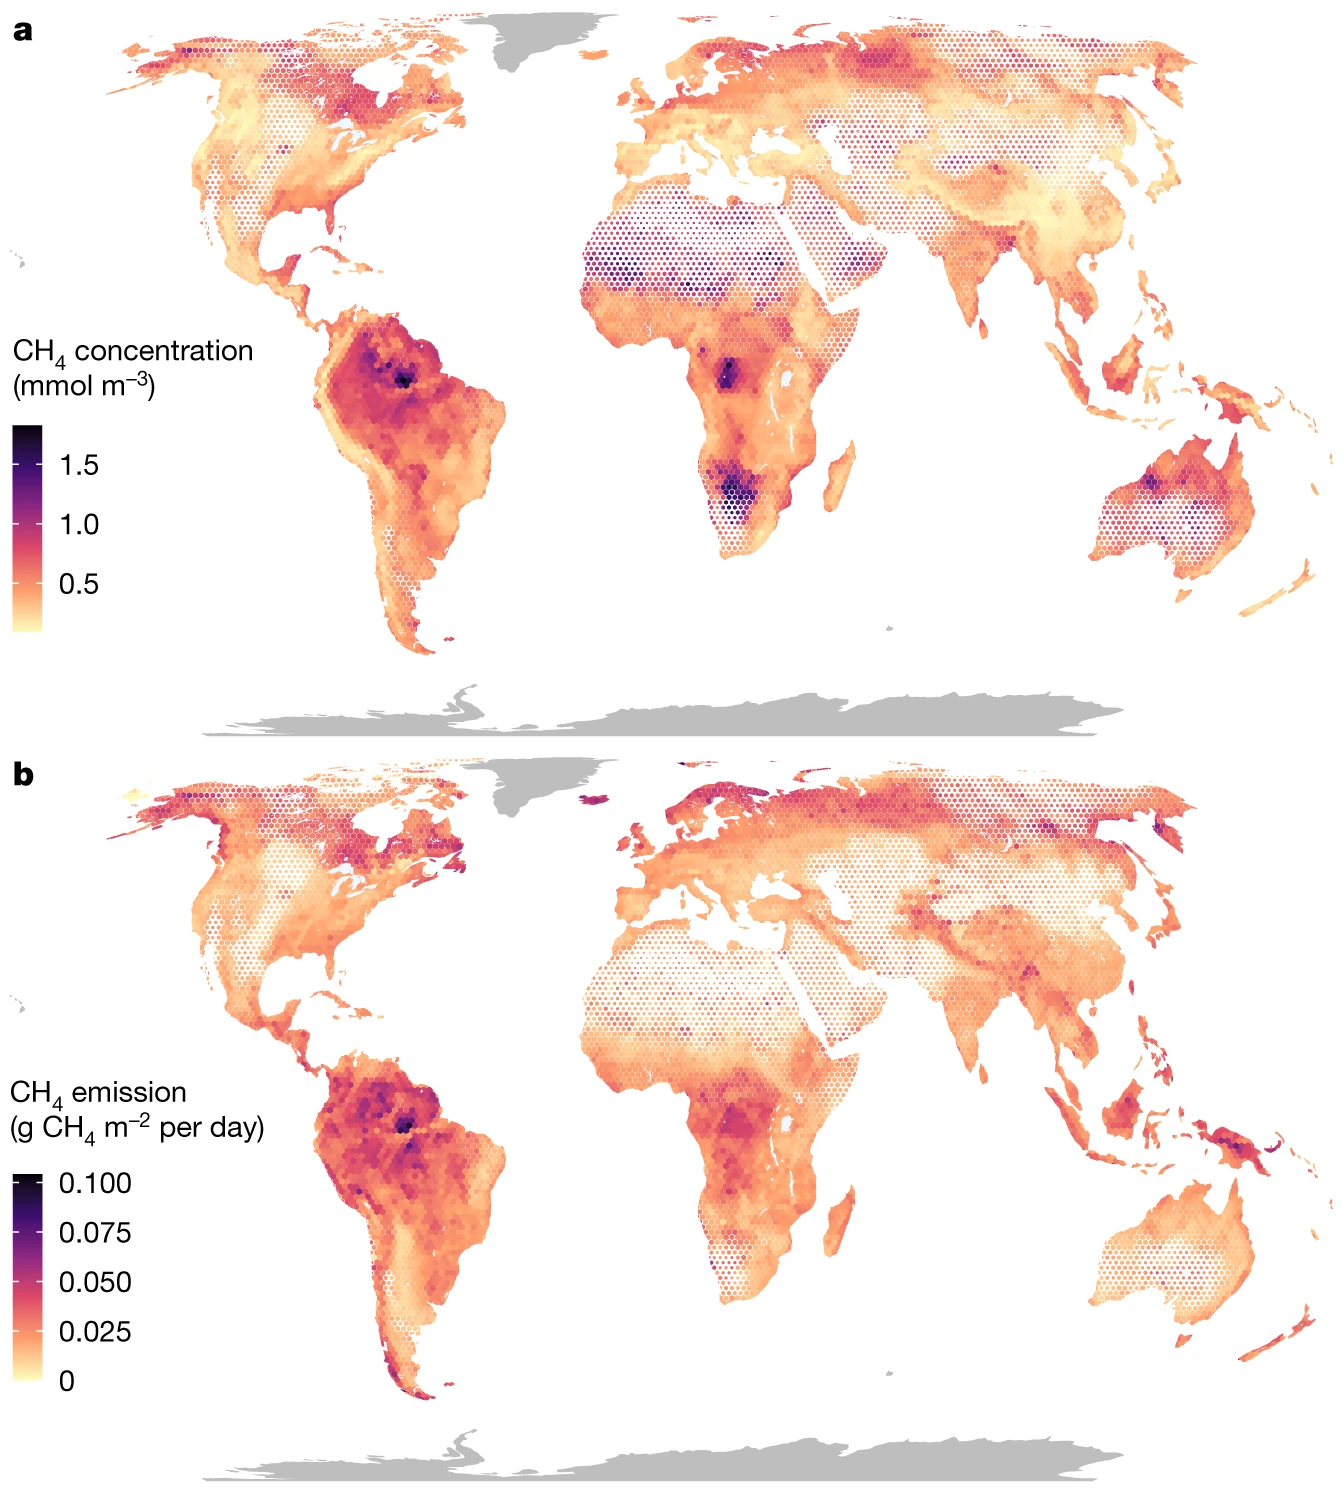
Global methane emissions from rivers and streams
Spoiler Legend :
a,b, Modelled yearly average CH4 concentrations (a) and emissions (b) in rivers and streams. Data have been aggregated in hexagonal bins, and the size of each hexagon is rescaled with runoff, to better visualize patterns in areas with high coverage of running waters. Areas with runoff greater than 1,500 mm per year have full-sized hexagons; hexagons in areas with runoff of 500 mm per year have been reduced by 10%; and hexagons with a runoff less than 50 mm per year have been reduced by 50%. The model could not be applied in Greenland and Antarctica, which are shown in dark grey.


Bonyduck Campersang
Not staring into the distance
- Joined
- Dec 11, 2022
- Messages
- 4,886
Bonyduck Campersang
Not staring into the distance
- Joined
- Dec 11, 2022
- Messages
- 4,886
Anti-China maps shared by Indian nationalists will never not be funny (not least for the fact that India is accused of being a hodgepodge of different nations united only by opposition to British imperialism):

Only gets worse from here


Peel away the occupied territories and there is nothing left: who is the real China?
Only gets worse from here
Peel away the occupied territories and there is nothing left: who is the real China?
danjuno
Cole Phelps, Badge 1247
Like Finland and Wyoming, it is not real!
JohannaK
Heroically Clueless
The first map is not altogether untruthful, especially with respect to Xinjiang and Tibet, but, oh I love the others, they're so crazy.
What is killing the worlds amphibians?

a,b, The primary drivers of deteriorating status among amphibians during 1980–2004 (482 species; a) and 2004–2022 (306 species; b). Cell colour was determined by the primary driver impacting the most species. Where two primary drivers equally contribute to a cell, an intermediate colour is shown. The stars indicate where the primary driver is undetermined or there are numerous primary drivers. The cell area is 7,775 km2. Source
a,b, The primary drivers of deteriorating status among amphibians during 1980–2004 (482 species; a) and 2004–2022 (306 species; b). Cell colour was determined by the primary driver impacting the most species. Where two primary drivers equally contribute to a cell, an intermediate colour is shown. The stars indicate where the primary driver is undetermined or there are numerous primary drivers. The cell area is 7,775 km2. Source
danjuno
Cole Phelps, Badge 1247
something something gay frogs
Bonyduck Campersang
Not staring into the distance
- Joined
- Dec 11, 2022
- Messages
- 4,886


- Status
- Not open for further replies.
Similar threads
- Replies
- 555
- Views
- 29K
- Replies
- 1K
- Views
- 98K
- Replies
- 1K
- Views
- 109K
- Replies
- 1K
- Views
- 132K