[RD] Daily Graphs and Charts

Status
Not open for further replies.
The score is measuring what, exactly?

It's also a little ridiculous that Wind Energy acceptance problems are in the same category as Nuclear Energy's.
 
Interesting, though it doesn't include cost or pollution. Maybe that's a good thing...

edit: @leoreth: the score appears to be "# of green boxes - # of red boxes"
 
edit: @leoreth: the score appears to be "# of green boxes - # of red boxes"
Makes sense. Not a very good metric, though.
 
Ehh, it's not bad for a broad index that aggregates qualitative and subjective measures.
 
American Binge Drinkers By Percentage

party-fails-booze-news-utah-wisconsin-american-binge-drinking-map.jpg


It says, for the purposes of this survey, a binge drinker is defined as one who often consumes five or more drinks (for men) or four or more drinks (for women) in unspecified "short period of time".


And a guy making faces with a glass while another guy sings a song about a monster from the swamps that gets killed with a crop duster and sold to a zoo is quite confusing too. The internet is that weird.

roflbot-FVeS.jpg
 
I am seriously disappointed in the South. I thought they all lazed around in clubs at night sipping bourbon and listenign to southern gee-tar.
 
Too bad that the criteria are of wildly unequal importance.
That's what the author is very much aware of, and the main point is the gap in general "easy-to-use"-ness to conventional fossile energy sources:

ff-score-1024x155.png


Tom Murphy said:
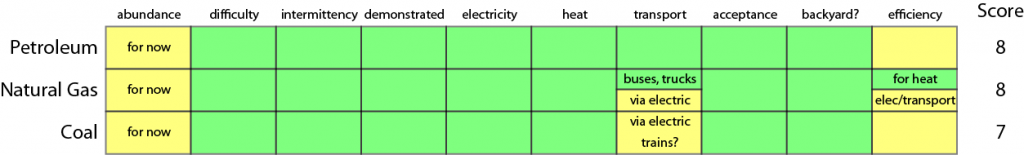
The scoring scheme should not be taken too seriously. Abundance is more important than whether something is backyard-compatible, for instance. Yet devising a weighting scheme struck me as adding unwarranted complexity and perhaps even increasing the subjectivity of the exercise. If you are so motivated, generate your own weighting scheme and change box colors while you're at it. Post it on a blog! Treat us to your biases.
Rather than fostering infighting among renewables, I hope the main points are not lost: that fossil fuels are qualitatively superior on the matrix categories, and that transportation without fossil fuels will be hard. The world is not static, and neither is the matrix. Reds can become yellow and green, with development. Greens could become yellow with depletion, etc.
 
I am seriously disappointed in the South. I thought they all lazed around in clubs at night sipping bourbon and listenign to southern gee-tar.

Lots of teetotalers in the South. There ain't nothing to do in the great plains/upper midwest besides get hammered. Plus, it helps you stay warm in teh winter.
 
Too bad that the criteria are of wildly unequal importance.

The score isn't supposed to be some all-inclusive ranking of them. The chart is just a way to easily compare their various advantages and disadvantages. The main goal of the author is to get people to realize just how difficult it will be to completely replace fossil fuels with renewable energy (fossil fuels would rate a perfect 10 on that chart).
 
Lots of teetotalers in the South. There ain't nothing to do in the great plains/upper midwest besides get hammered. Plus, it helps you stay warm in teh winter.
That's what I like about Swedish-Americans, they're subtle about keeping their traditions alive. The Irish and Italians need to throw big parades, make a lot of noise, but the Swedes will just sit quitely out in South Minnebraska getting slowly but surely stocious for three months straight just like their ancestors have done for thousands of years. :D
 
its logical conclusion, which would be year/month/day/hour/minute/second. Right now it would be 2012-02-07-16-40-27. Look how neat that is! :D

Which is exactly how it's done where I work.

year-month-day-(etc) makes a lot of sense in the computer age, because when you sort things alphabetically they are also sorted by date.

... and this is why.

Obligatory graph (speaking of computers):
1604pg26_chart.gif
 
does the amount of investment in processor development as a % of world wide income change substantially over that period?
 
I am seriously disappointed in the South. I thought they all lazed around in clubs at night sipping bourbon and listenign to southern gee-tar.
Nope. For Wisconsin, they lack the Protestant Work Ethic found by Good Upstanding Swedes in Minnesota, and instead decide it is too cold to be sober.
 
P. Krugman said:
Aaron Carroll of The Incidental Economist and I have been emailing back and forth about the extent to which conservative states tend to be much more dependent on government support than liberal states, and Aaron has produced a nice chart. He takes the top ten most conservative and liberal states as ranked by Gallup, plots the conservative minus liberal score on the X-axis, and the ratio of transfers to personal income on the Y-axis:

021312krugman2-blog480.jpg


http://krugman.blogs.nytimes.com/2012/02/13/red-moochers/
 
Not surprising given that democrat voters are often young people living in large metropolitan cities where you are likely to find a lot of inner city poverty and poor out of college students.
 
Status
Not open for further replies.
Back
Top Bottom