10,000 words, no abstract. Care to summarise it? I just started, and it does not seem to make sense:
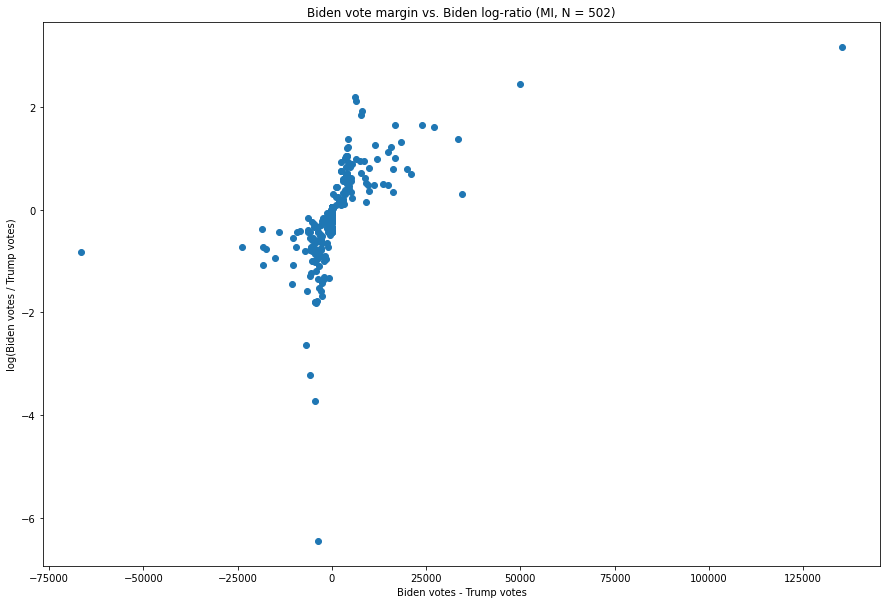
In other words, it's not surprising to see vote updates with large margins, and it's not surprising to see vote updates with very large ratios of support between the candidates, but it is surprising to see vote updates which are both
Why? Are they not mathematically related with the total vote number? So in this graph: If you added vote number you would get a constant function? So all they are really saying is that there were 4 large pro-Biden sets of votes, because Biden gets votes in densely populated areas?
[EDIT] From
wolfram alpha, yeah they are directly related with sample size, but how is "(x-y) / log(x/y)" related to "the average wait time to roast a 10 lb turkey"?
")


")